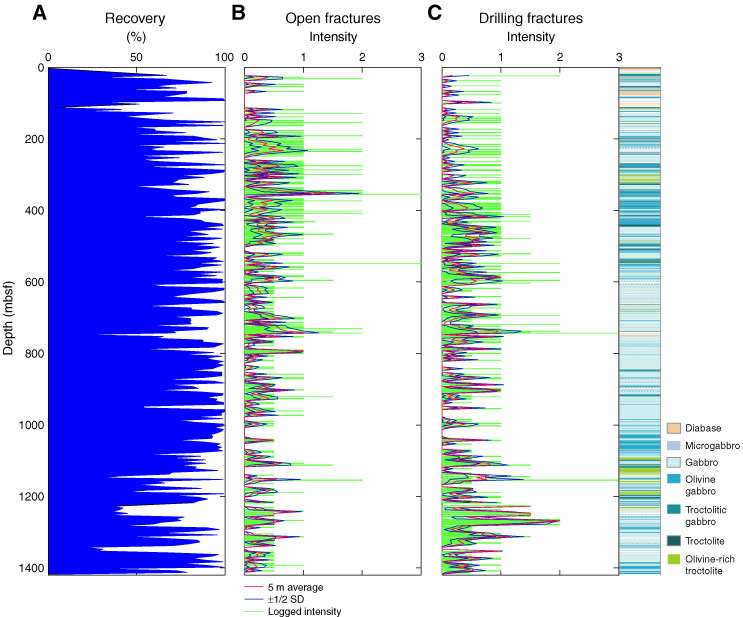
Figure F198. A. Variation of percent rock recovery. B. Variation of open crack intensity. C. Drilling-induced fractures, estimated from core observations in Hole U1309D. The column on the right corresponds to lithostratigraphy in Hole U1309D. SD = standard deviation.

Previous | Close | Next | Top of page