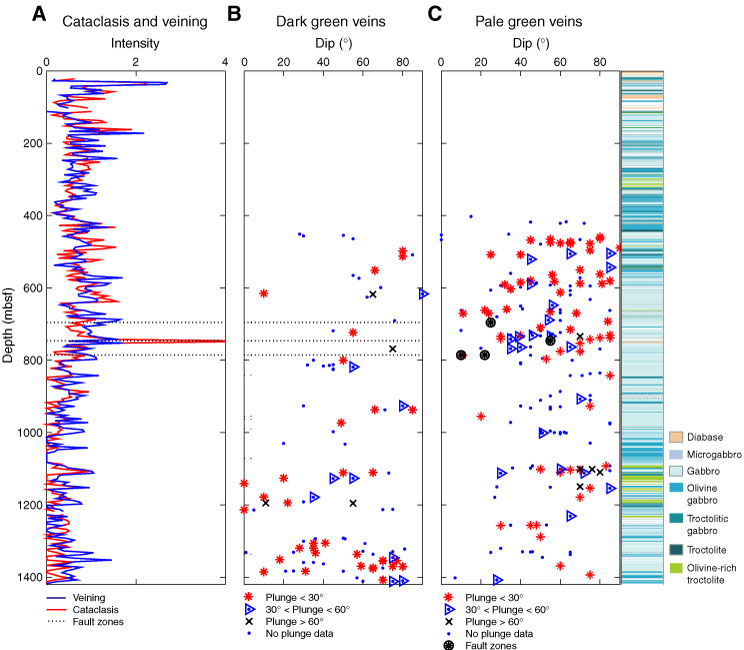
Figure F197. A. Average cataclastic and veining intensity in Hole U1309D (5 m average from Fig. F182). B. Dip of dark green fault veins, with indication of measured plunges. C. Dip of pale green fault veins, with indication of measured plunges. The column on the right corresponds to lithostratigraphy in Hole U1309D.
Previous | Close | Next | Top of page