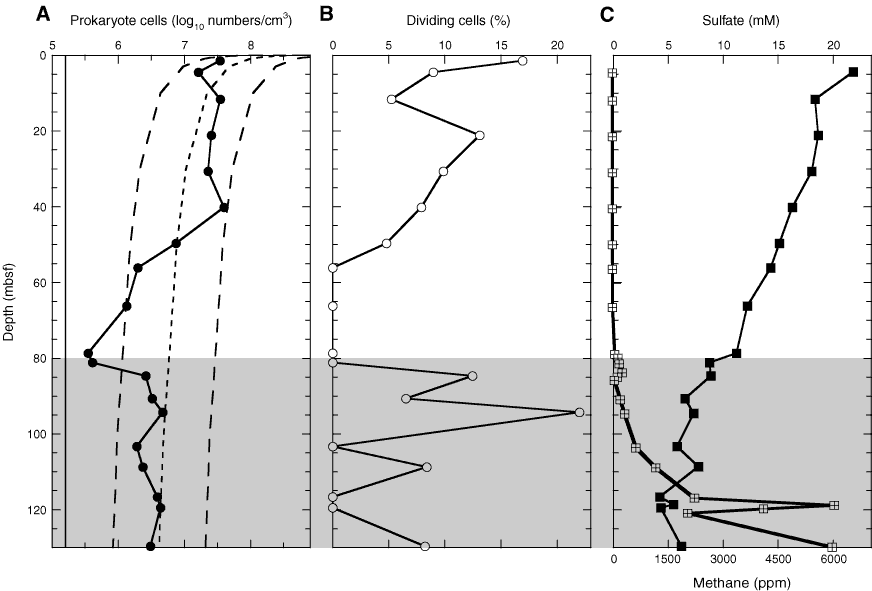
Figure F29. A. Total prokaryotic cells (solid circles) vs. depth. Dotted line = global prokaryote profile (Parkes et al., 2000) (log10 cells = 8.03–0.66 × log10 depth [m]), dashed lines = upper and lower prediction limits for this profile, vertical line = detection limit (5.3). B. Percentage of total population involved in cell division vs. depth. C. Geochemical profiles of sulfate (solid squares) and methane (crossed squares). Shading = presence of significant methane concentrations.

Previous | Close | Next | Top of page