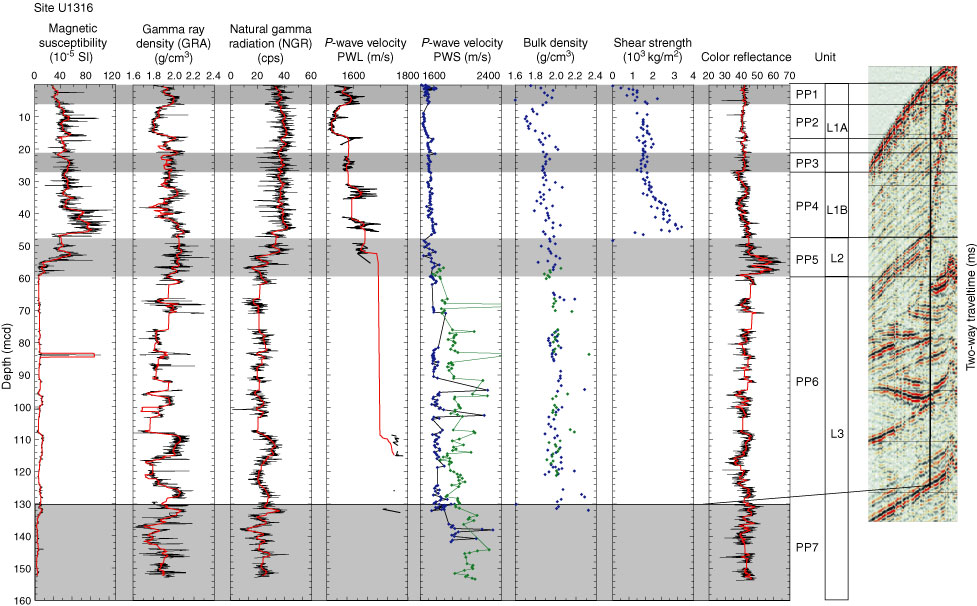
Figure F30. Overview of the spliced depth curves of the different physical properties correlated with local sparker seismics (Line P000660). P-wave sensor (PWS) velocity, bulk density, and shear strength are plotted by hole. Blue = Hole U1316A, green = Hole U1316C. GRA = gamma ray attenuation, PWL = P-wave logger, Red line = running average. Logging and physical property units are shown.
Previous | Close | Next | Top of page