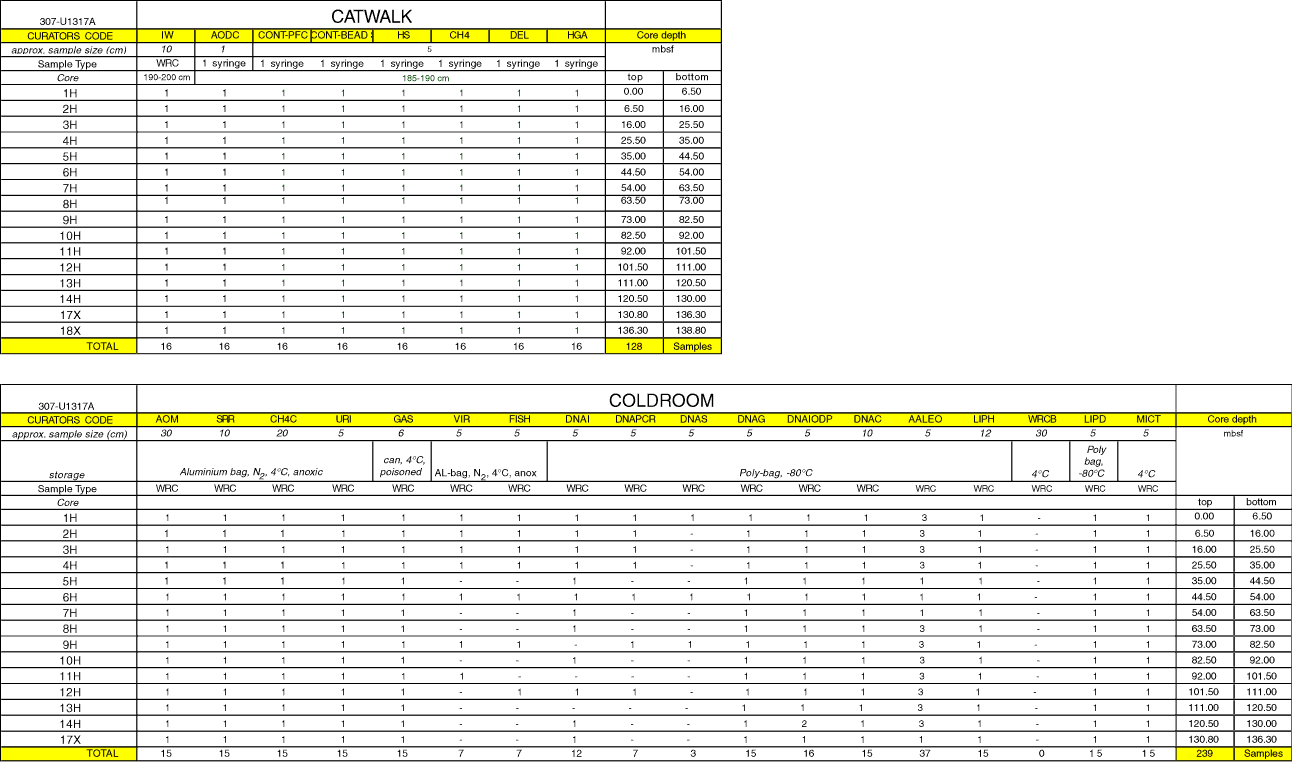
Figure F19. Graphic representation of subsampling and analysis program for the MBIO core sections from Hole U1317A. The sequence of subsections runs from the top of the core (right) toward the bottom (left). See Table T4 in the "Methods" chapter for explanation of sampling codes.

Previous | Close | Next | Top of page