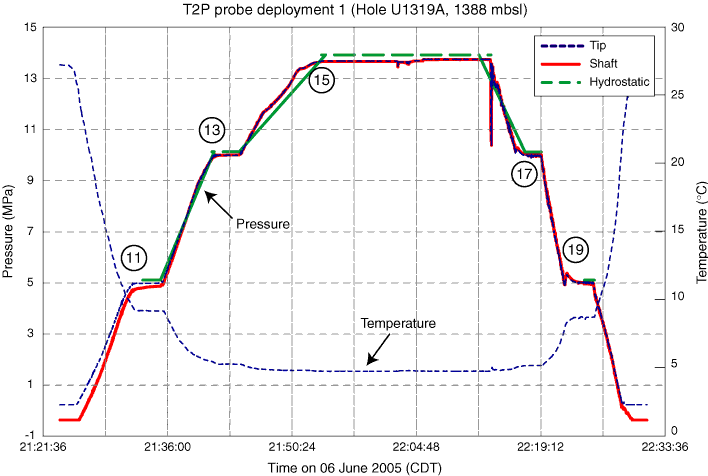
Figure F45. Pressure and temperature measured during Deployment 1 of the temperature/dual pressure (T2P) probe. A time series of deployment events (circled numbers) is provided in Table T15. Calculated hydrostatic pressure (green line) is plotted for comparison to the reference pressure measurements. Water density is assumed to be 1.024 g/cm3 for the hydrostatic calculation. CDT = Central Daylight Time. Raw data are provided in “Downhole” in “Supplementary material.”

Previous | Close | Next | Top of page