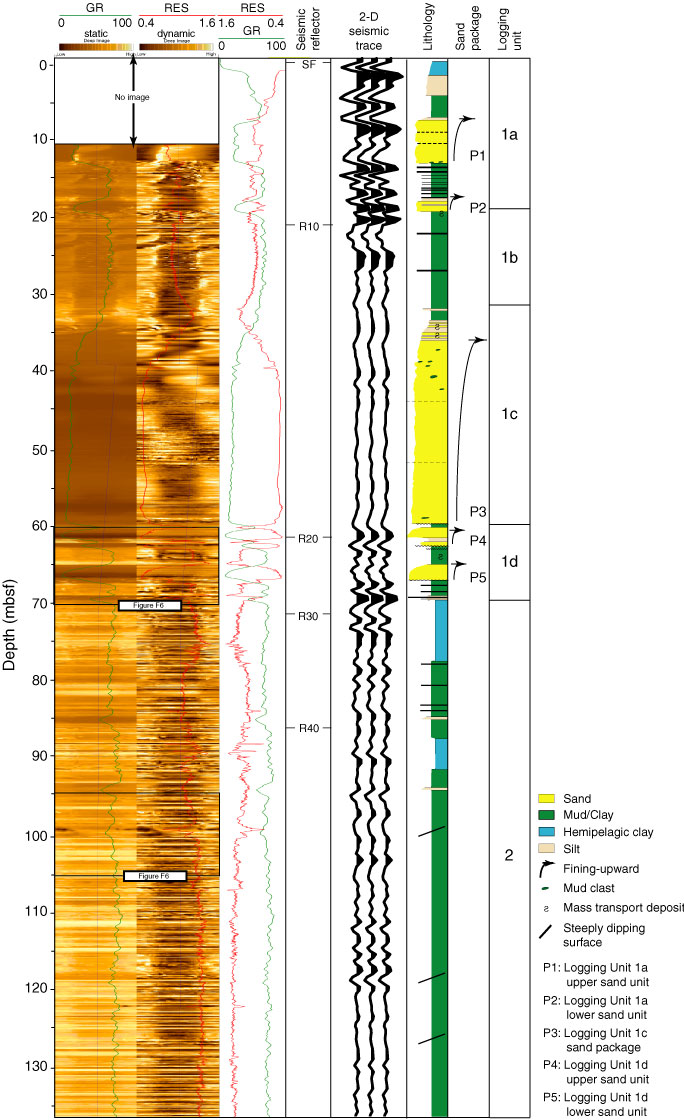
Figure F5. Summary diagram of Hole U1321A. Static and dynamic normalized resistivity-at-the-bit (GVR) images for Hole U1321A. Gamma ray (GR; green) and RING (red) resistivity (RES) logs are overlain on the static and dynamic resistivity images. The third column shows the gamma ray and RING resistivity (resistivity on reversed scale) data to highlight lithology. Seismic reflectors and extracted 2-D seismic trace are plotted in columns 4 and 5. Log-based lithology is identified. Boxes on resistivity images identify sections shown in Figure F6. SF = seafloor.
Previous | Close | Next | Top of page