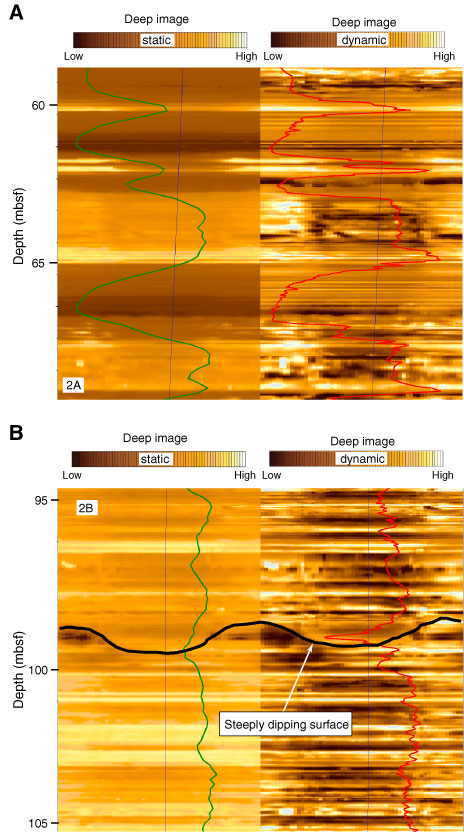
Figure F6. A. GVR image showing interbedded sand and mud/clay beds characteristic of logging Subunit 1d. Dark bands (static GVR image) with low gamma ray and low resistivity response are interpreted as sand beds with intervening mud intervals. B. GVR image showing dipping surface, probably a fault, cutting logging Unit 2.
Previous | Close | Next | Top of page