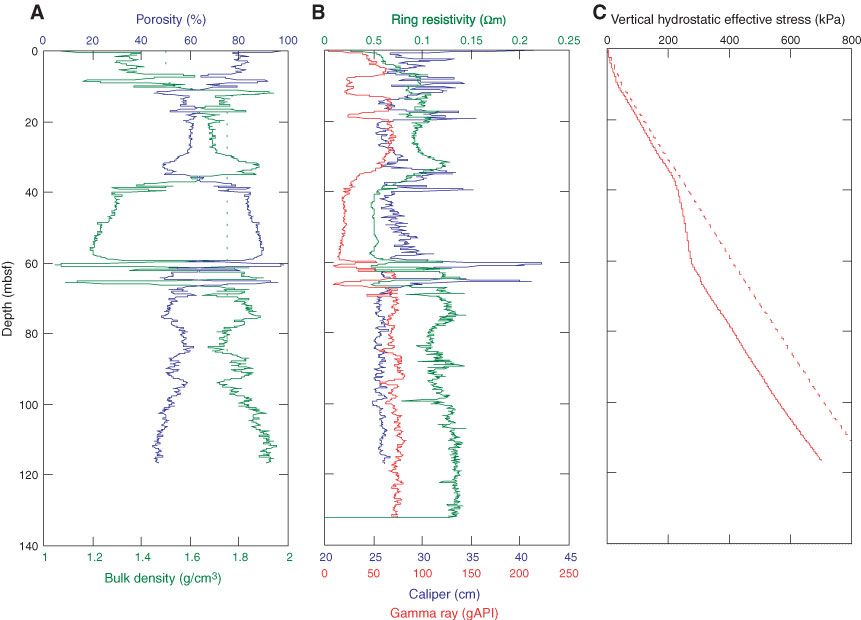
Figure F7. A. LWD bulk density data and derived porosity. Dashed line = threshold densities used to calculate a vertical hydrostatic effective stress (σvh′) profile, shown in C. The densities used for the thresholds in the upper 20 m and below 20 mbsf are based on results at Sites U1319 and U1320. B. Caliper (hole diameter), gamma radiation, and RING resistivity measured from LWD data. C. Vertical hydrostatic effective stress. Dashed line shows the vertical hydrostatic effective stress derived from densities above determined thresholds shown in A.
Previous | Close | Next | Top of page