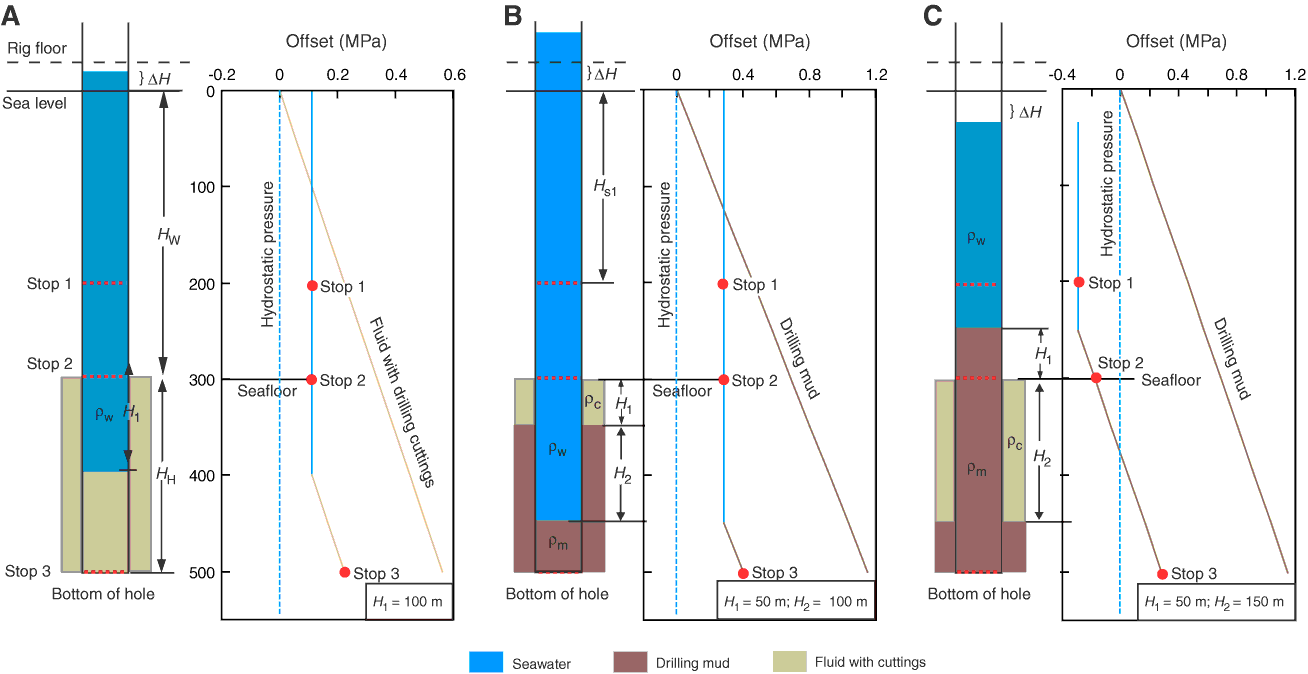
Figure AF10. Three possible scenarios that could be encountered at tool stops. The drill pipe above the rig floor was assumed to be sufficiently long, and three fluids with different density do not mix. A. Predicted fluid pressure profile for cases where no drilling mud was used and fluid in the borehole is contaminated with drilling cuttings. B. Predicted fluid pressure profile for cases where drilling mud was used to stabilize the borehole and mud elevation within the pipe is lower than the mud elevation outside the pipe. C. Predicted fluid pressure profile for cases where drilling mud was used to stabilize the borehole and mud elevation within the pipe is higher than the mud elevation outside the pipe. Brown line = predicted static pressure by assuming the borehole was filled with a 10.5 ppg drilling mud. ρw = density of seawater (1.024 g/cm3), ρm = density of drilling mud (1.259 g/cm3; 10.5 ppg), ρc = density of fluid with cuttings (1.139 g/cm3; 9.5 ppg), HW = water depth at hole location, HH = hole depth, Hs1 = water depth at Stop 1, ΔH = offset in hydrostatic pressure, H1 = hydrostatic pressure at Stop 1, H2 = hydrostatic pressure at Stop 2.

Previous | Close | Top of page