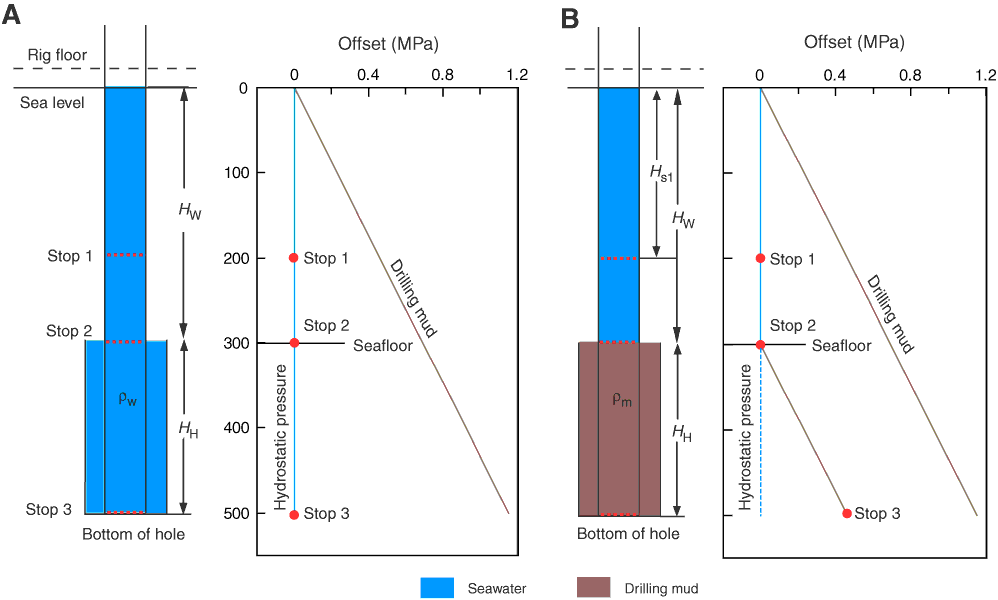
Figure AF9. Two ideal scenarios of fluid condition in drill pipe A. Predicted fluid pressure profile for cases in which no drilling mud was used and the seawater was not contaminated with the drilling cuttings. B. Predicted fluid pressure profile for cases in which drilling mud was used and the mud elevations inside and outside the pipe are at seafloor. Brown line = predicted static pressure assuming the borehole was filled with a 10.5 ppg drilling mud. ρw = density of seawater (1.024 g/cm3), ρm = density of drilling mud (1.259 g/cm3; 10.5 ppg), HW = water depth at hole location, HH = hole depth, Hs1 = water depth at Stop 1.

Previous | Close | Next | Top of page