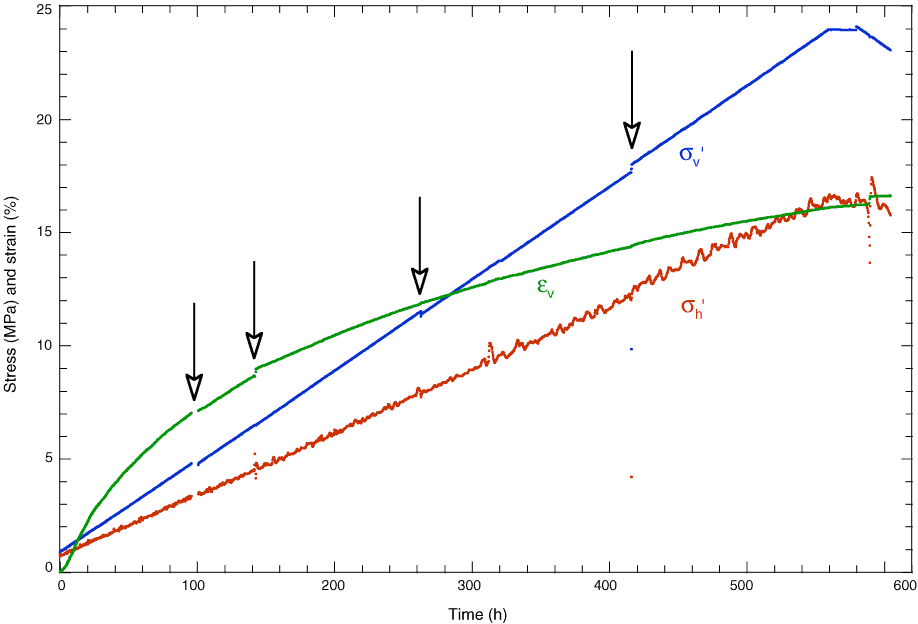
Figure F3. Plot of results from the reconsolidation phase. Effective vertical (σv′) and horizontal (σh′) stress and vertical strain (εv) are plotted vs. time. Open arrows = times for unexpected test shut-down. Plot shows that test conditions remained quite constant before and after test shut-down.
Previous | Close | Next | Top of page