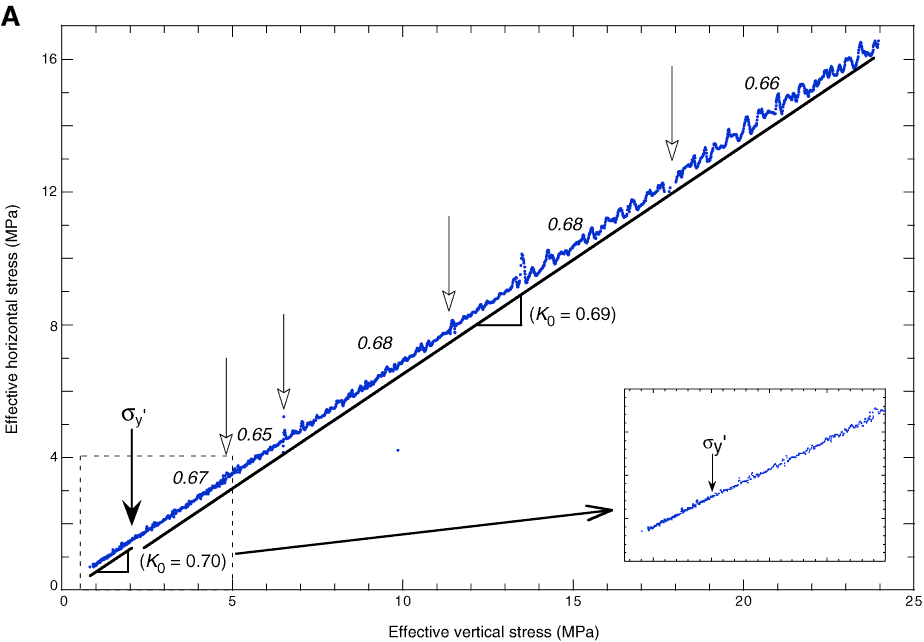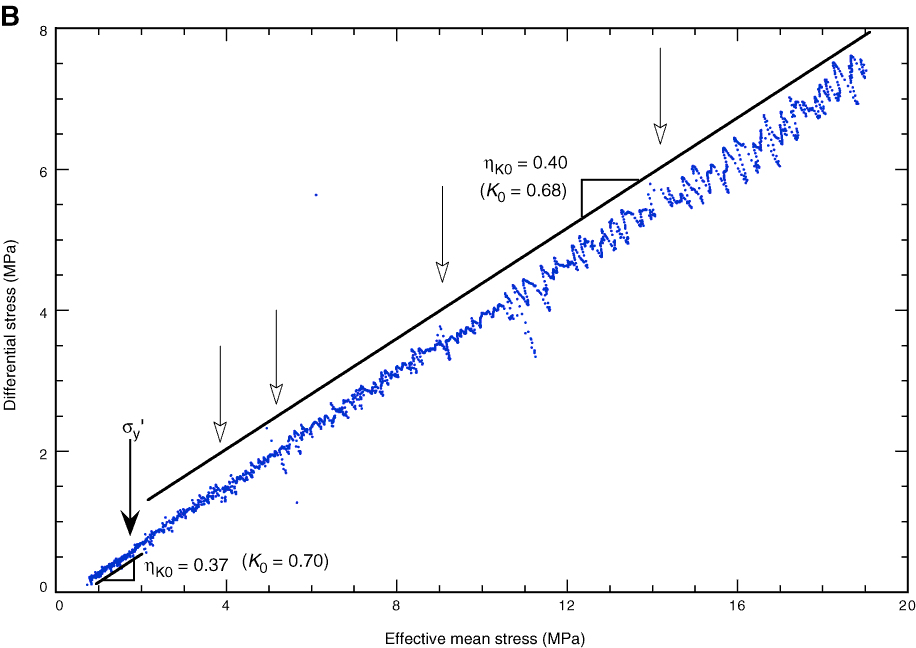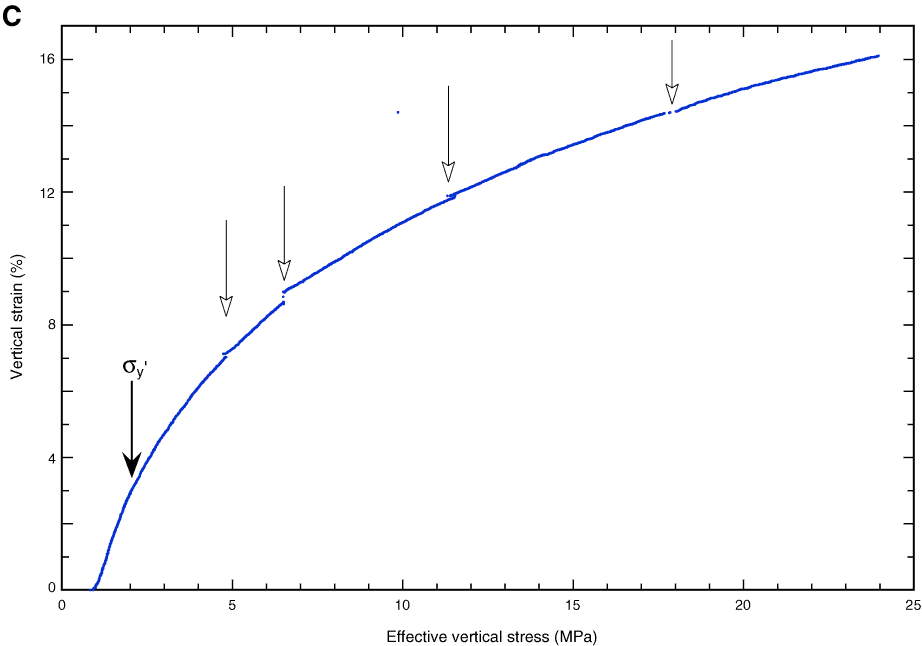
Figure F4. Plots of results for Sample 1320-31-1. A. Effective horizontal stress (σh′) plotted against effective vertical stress (σv′). Open arrows = times for unexpected test shut-down, solid arrow = effective vertical yield stress (σy′), which is subtle in the stress-stress plots (e.g., insert of A) and more distinct in the strain-stress plot (C). Slope of curve = stress ratio (K0 in A; ηK0 in B). Values in italics in (A) = K0 values for sections with continuous data collection. B. Differential stress (Δσ) plotted against effective mean stress (σm′). C. Vertical strain (εv) plotted against effective vertical stress (σv′).


Previous | Close | Top of page