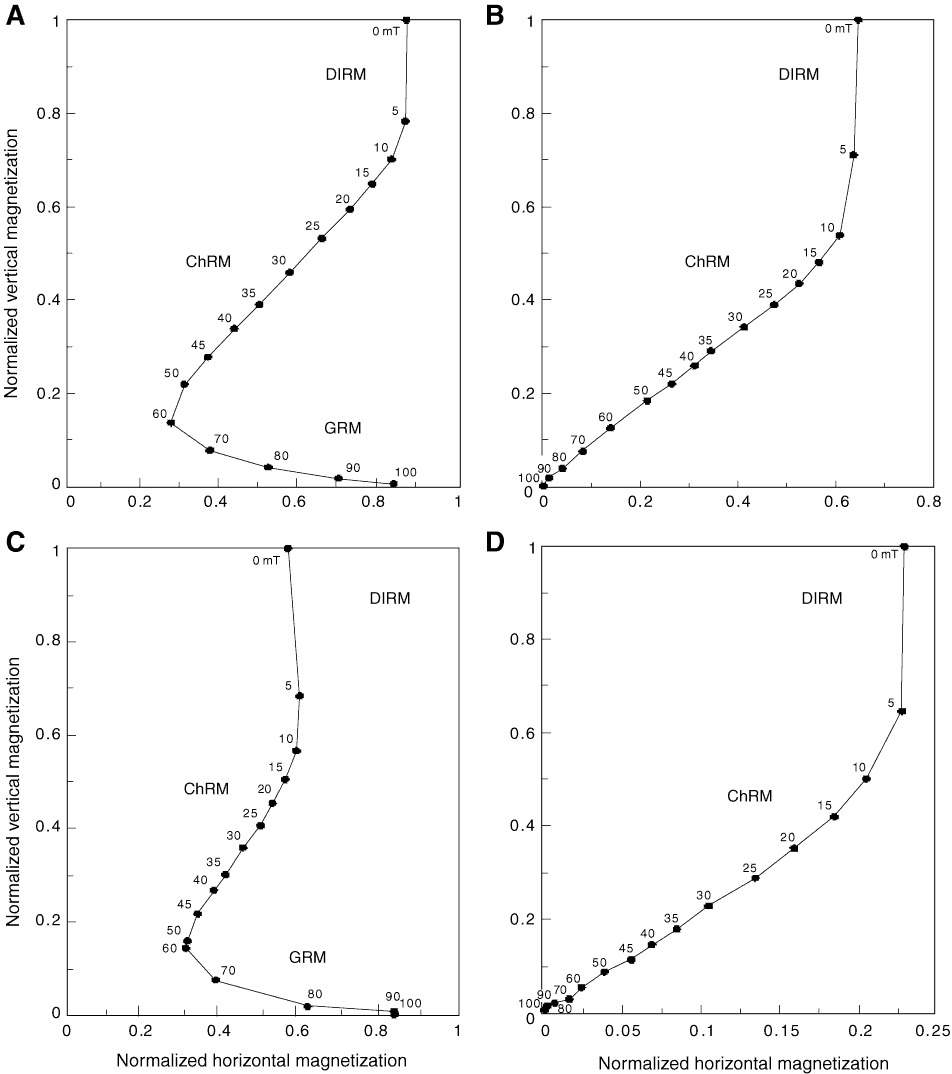
Figure F2. Representative orthogonal vector plots of AF demagnetization steps, Sites U1319 and U1320. A. Type 1 curve, Hole U1319A (8.26 mbsf). B. Type 2 curve, Hole U1319A (16.26 mbsf). C. Type 1 curve, Hole U1320A (163.96 mbsf). D. Type 2 curve, Hole U1319A (188.86 mbsf). Type 1 curves show directional deviation during the first few low-field steps, which usually disappears after the 30 mT step, followed by characteristic remanent magnetization (ChRM) directions pointing toward the coordinate center. Type 2 curves show the same starting trend but additionally develop a strong horizontal deviation at higher demagnetization steps. DIRM = drilling-induced remanent magnetization, GRM = gyroremanent magnetization.

Previous | Close | Next | Top of page