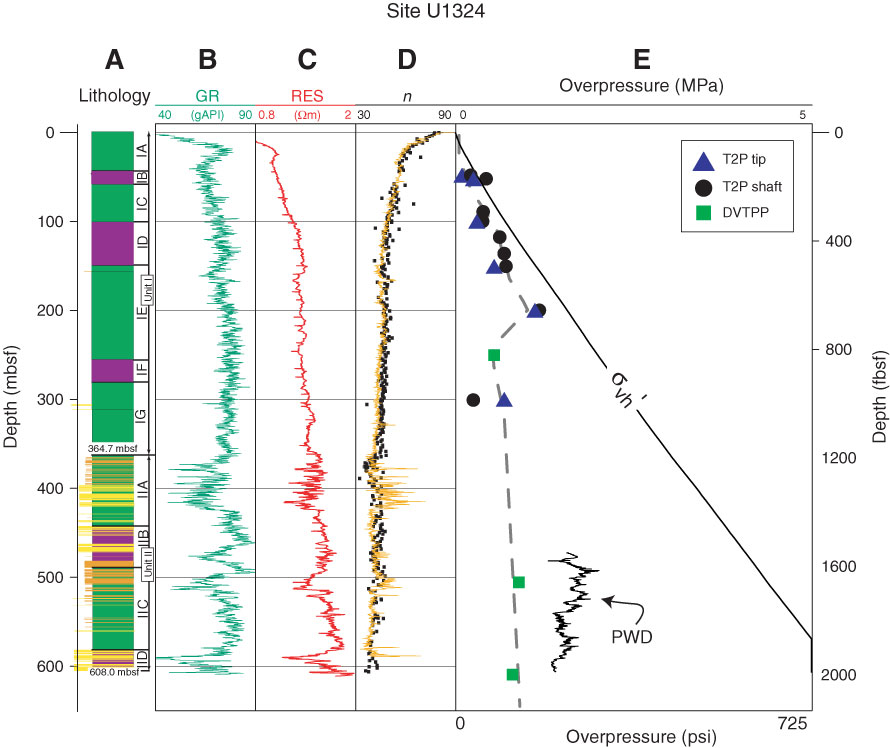
Figure F3. Site U1324 summary (modified from Flemings et al., 2008). A. Lithology. Purple shaded areas are mass transport deposit zones. B. Gamma radiation (GR) from LWD data. C. Resistivity (RES) log. D. Porosity log interpreted from shipboard moisture and density measurements (squares) and porosity interpreted from LWD bulk density log assuming a grain density of 2.74 g/cm3 and fluid density of 1.024 g/cm3 (orange line). E. Overpressure using the inverse square root of time method (Flemings et al., 2008). Pressure measured while drilling (PWD) is shown with solid line. Gray dashed line is the interpreted in situ pressure. Overpressures (u*) are calculated by subtracting the hydrostatic pressure (uh) from the measured pressure (u). uh is calculated assuming a pore fluid density (ρw) of 1.024 g/cm3 (uh = ρwgz). σvh′ is the hydrostatic effective stress (σvh′ = σv – uh). The overburden stress (σv) is calculated by integrating shipboard-derived core density measurements. DVTPP = Davis-Villinger Temperature-Pressure Probe, T2P = temperature/dual pressure probe.
Previous | Close | Next | Top of page