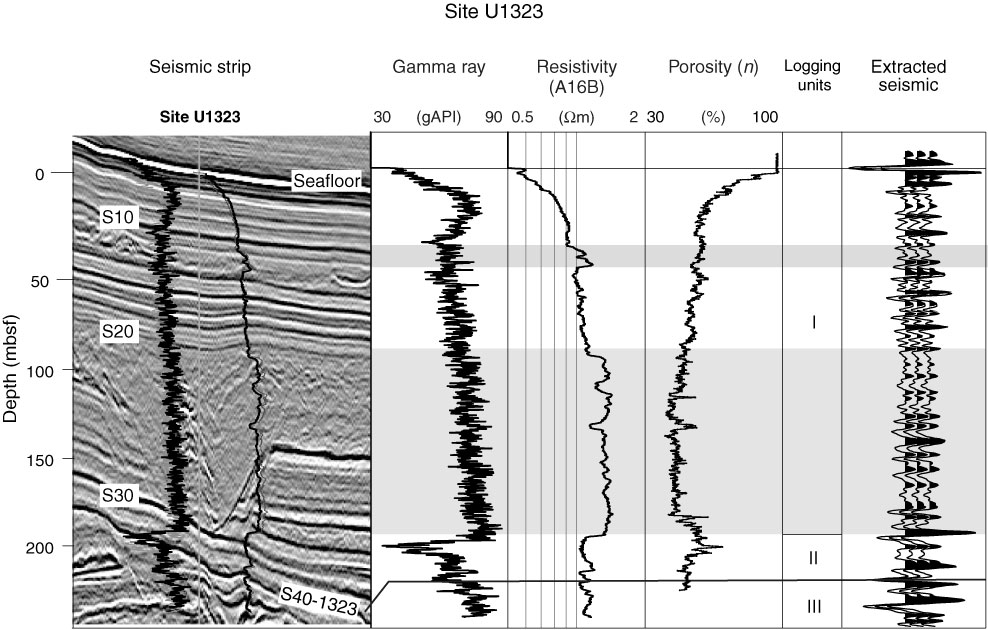
Figure F4. Site U1323 summary. Seismic strip from cross-section A–A′ (Fig. F1) with gamma ray and resistivity curves tied to seismic log. Log and core data and description of logging units from Expedition 308 (see the “Expedition 308 summary” chapter [Expedition 308 Scientists, 2006]). Log-derived porosity is based on the bulk density log assuming 2.74 g/cm3 grain density and 1.024 g/cm3 fluid density. Gray shaded zones represent mass transport deposits. Figure from Sawyer et al. (2009).
Previous | Close | Next | Top of page