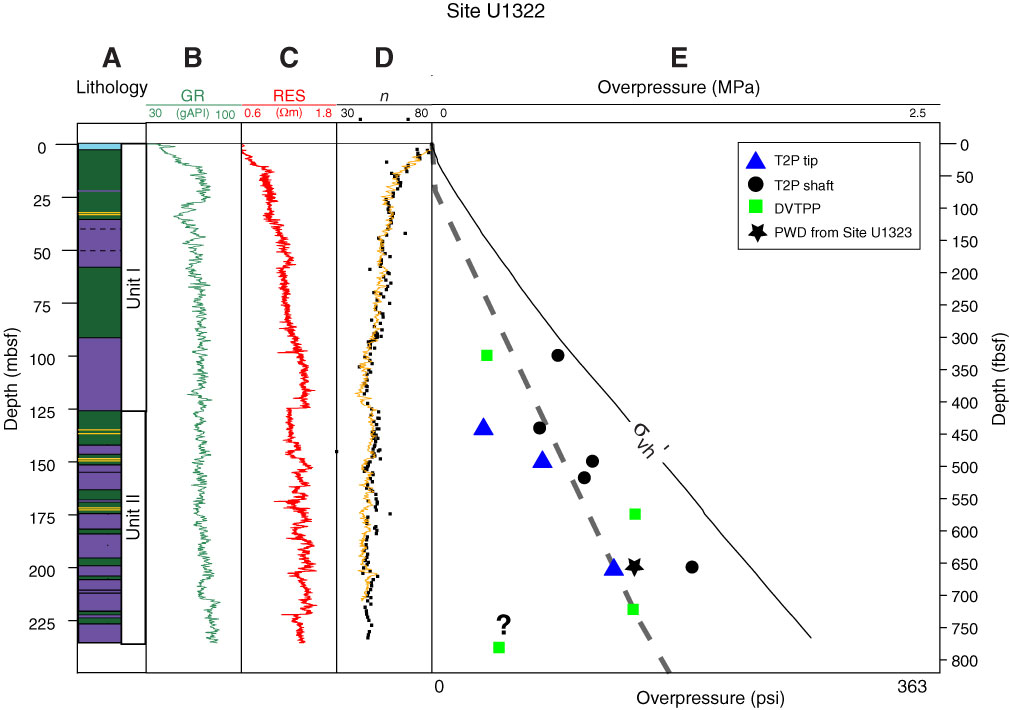
Figure F5. Site U1322 summary. Figure modified from Flemings et al. (2008). A. Lithology. Purple shaded areas are mass transport deposits zones. B. Gamma radiation (GR) from LWD data. C. Resistivity (RES) log. D. Porosity log interpreted from shipboard moisture and density measurements (squares) and porosity interpreted from LWD bulk density log assuming a grain density of 2.74 g/cm3 and fluid density of 1.024 g/cm3 (orange line). E. Overpressure using the inverse square root of time method (Table T1). The “?” marks the deepest pressure measurement that has an anomalously low pressure relative to the overlying pressure measurement (see text for a discussion). Pressure during shallow water flow at Site U1323 is illustrated with a star. The grey dashed line is the interpreted in situ pressure. Overpressures (u*) are calculated by subtracting the hydrostatic pressure (uh) from the measured pressure (u). uh is calculated assuming a pore fluid density (ρw) of 1.024 g/cm3 (uh = ρwgz). σvh′ is the hydrostatic effective stress (σvh′ = σv – uh). The overburden stress (σv) is calculated by integrating shipboard-derived core density measurements.
Previous | Close | Next | Top of page