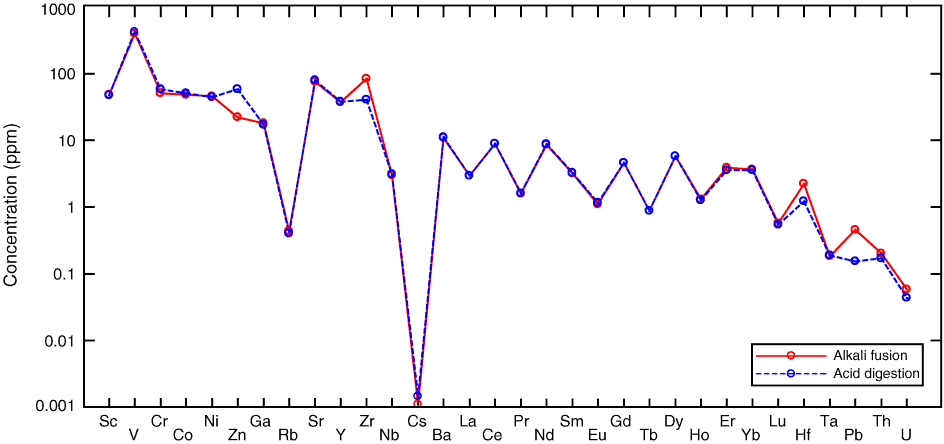
Figure F3. Comparison of inductively coupled plasma–mass spectrometry analyses of Sample 312-1256D-184R-1, 0–8 cm, dissolved by acid digestion and following alkali fusion. Zr, Hf, Th, and U values by acid digestion are lower than those by alkali fusion, indicating the presence of acid-resistant minerals.

Previous | Close | Next | Top of page