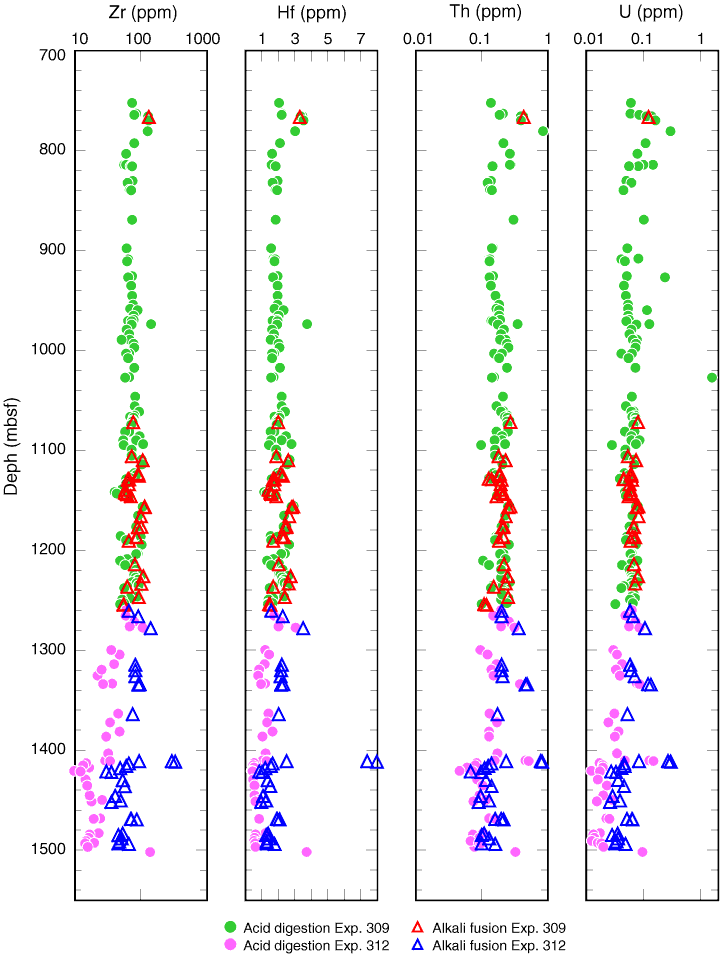
Figure F4. Downhole variations of Zr, Hf, Th, and U abundances of inductively coupled plasma–mass spectrometry analyses by acid digestion and alkali fusion. The discrepancy between the two dissolution methods becomes prominent in samples from deeper than ~1300 mbsf.

Previous | Close | Next | Top of page