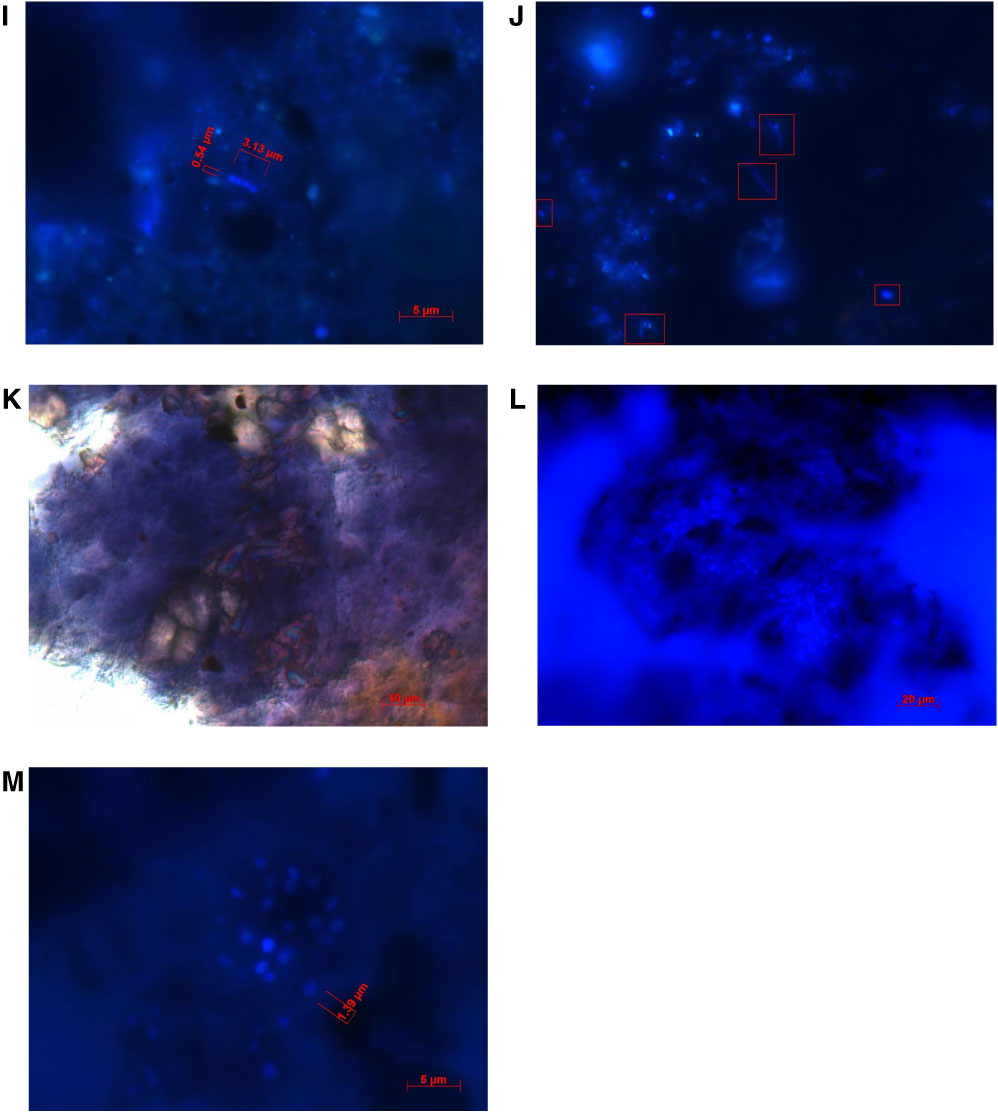
Figure F3 (continued). I. Chains of cells (Hole M0007C, 5.88 mbsf). Cells were common in this sample. J. Rather high diversity of cell morphologies (Hole M0007C, 5.88 mbsf). Cells were common in this sample. K. Blue/purple biofilm with carbonate mineral inside (Hole M0015B, 0.47 mbsf). L. High abundance of cells in a biofilm (Hole M0015B, 0.47 mbsf). M. Same as L, in a higher magnification, showing colonies of cells (~1.4 µm) in a biofilm.

Previous | Close | Next | Top of page