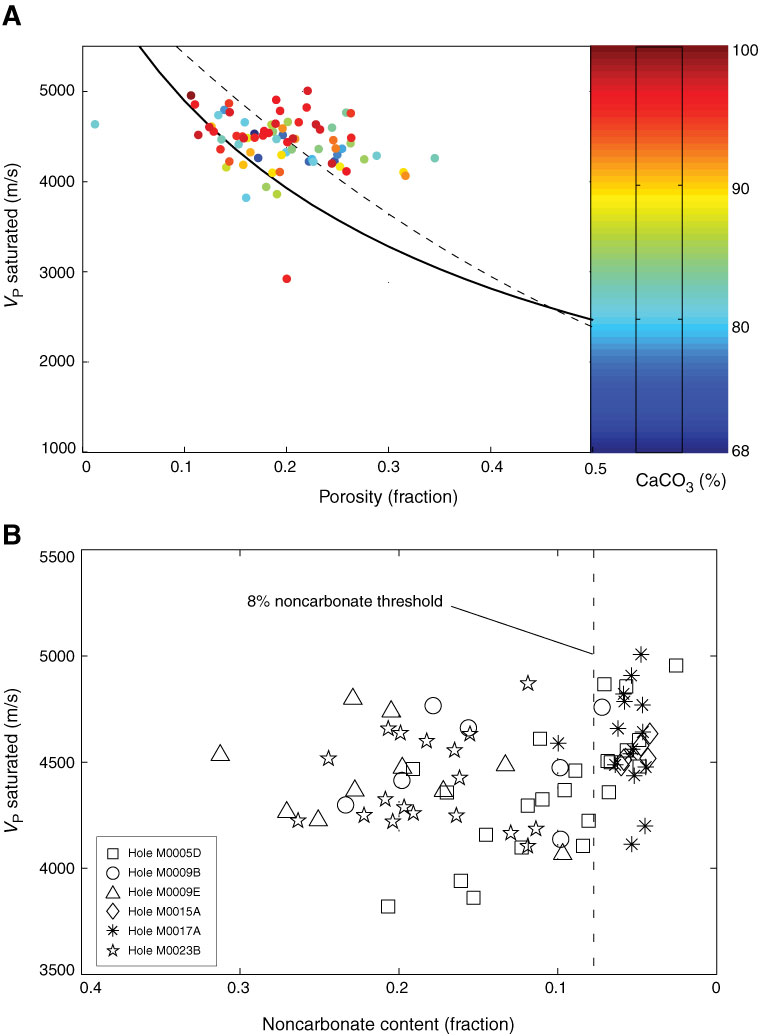
Figure F7. A. Cross-plot of velocity vs. porosity colored for carbonate content. Solid line = Wyllie (time-average) equation, dashed line = Raymer equation. B. Diagram of relationship between acoustic velocity and fraction of noncarbonate content.
Previous | Close | Next | Top of page