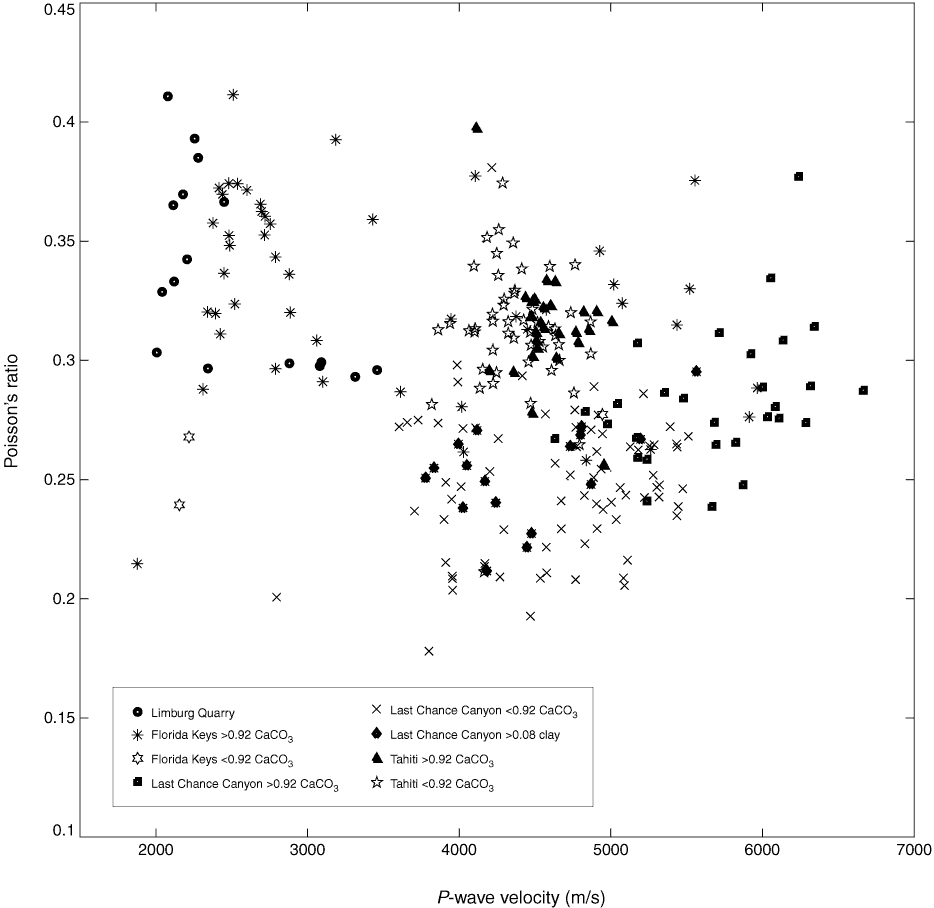
Figure F8. Cross-plot of Poisson’s ratio vs. P-wave velocity for the Tahiti data set along with various literature data sets (Limburg Quarry, Kenter et al. 1997a; Florida Keys, Anselmetti et al., 1997; Last Chance Canyon, Kenter et al. 1997b). Data sets have been discriminated for noncarbonate content (8% threshold) and the presence of clay (>8% threshold). Immature clean carbonate data sets (Limburg Quarry and Florida Keys) are situated in the upper left quadrant. Tahiti sample set is separated at 4500 m/s by the presence of >8% noncarbonate material. Last Chance Canyon data also show portioning after mineralogy but have experienced burial diagenesis with significant lower Poisson’s ratios as result.
Previous | Close | Next | Top of page