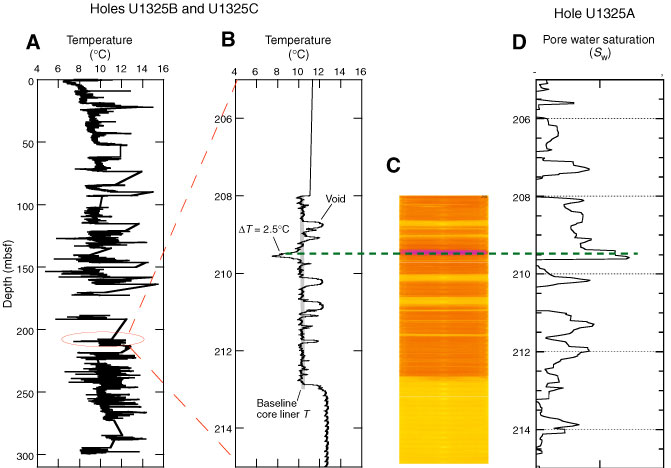
Figure F36. A. Downhole temperature in Holes U1325B and U1325C based on concatenation of core liner temperatures averaged across each pixel row (see text for details). B. Core liner temperature profile for Core 311-U1325C-4X. The local no-gas-hydrate, no-void baseline is clear, along with a cold anomaly interpreted to have been caused by gas hydrate dissociation and several warm anomalies caused by voids. C. IR image of Core 311-U1325C-4X. D. Pore water saturation calculated from LWD resistivity data for 205–215 mbsf in Hole U1325A.
Previous | Close | Next | Top of page