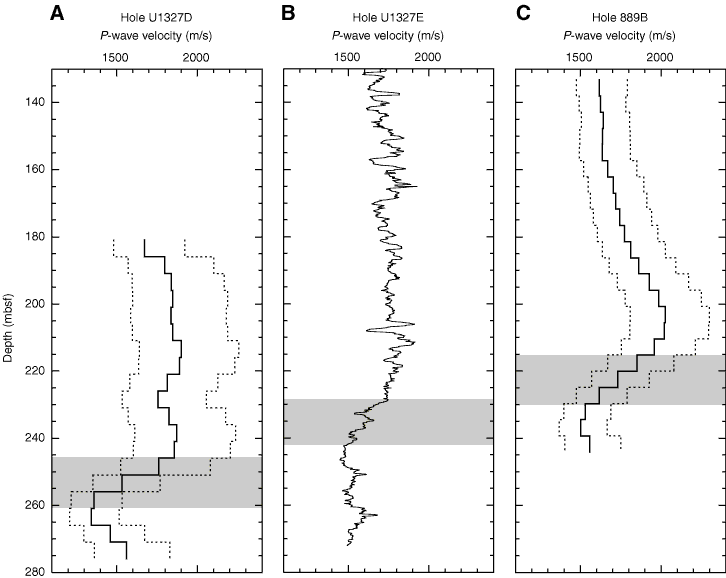
Figure F65. (A) Interval velocity inversion of the first break times in the Hole U1327D vertical seismic profile (VSP), compared to (B) the P-wave velocity sonic log from Hole U1327D, and (C) an interval velocity inversion from the Hole 889B VSP. Dashed line = ±1 posterior standard deviation, shaded area = intervals of steep decrease in velocity with depth that correspond to the BSR.

Previous | Close | Next | Top of page