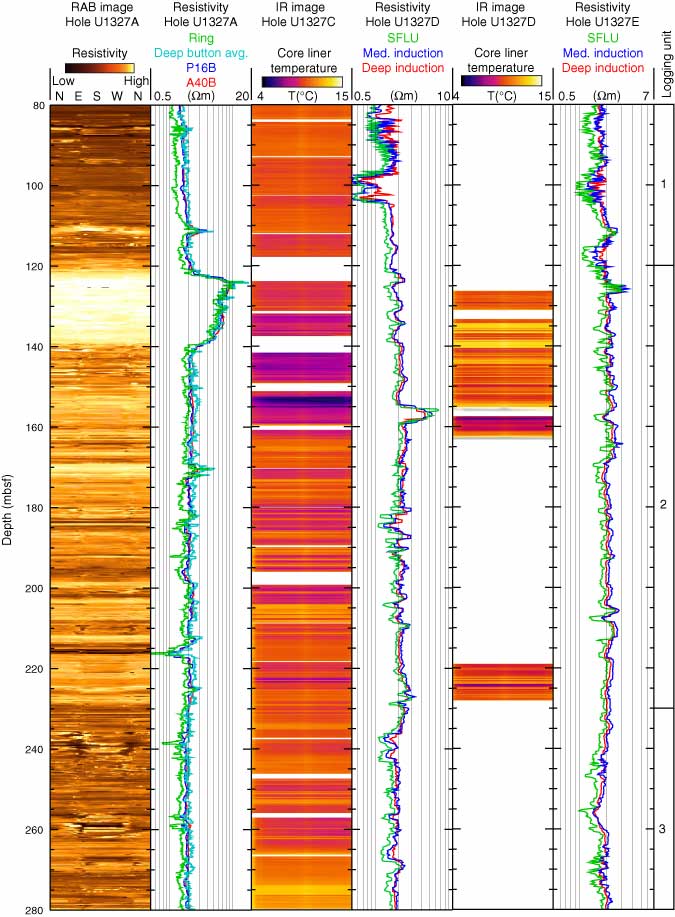
Figure F66. Illustration of the lateral variability in gas hydrate distribution at Site U1327. RAB = resistivity-at-the-bit image obtained by the GeoVISION tool, avg = average, P16B = phase-shift resistivity measured by the EcoScope tool at a source-receiver spacing of 16 in (41 cm), A40B = attenuation resistivity measured by the EcoScope tool at a source-receiver spacing of 40 in (102 cm), IR = infrared, SFLU = spherically focused resistivity, Med. = medium. High hydrate concentrations are marked by light intervals (high resistivity) in the RAB image, purple to red intervals (cold temperatures) in the IR images, and high resistivities in the resistivity logs. The high resistivity interval in Hole U1327A (120–140 mbsf) correlates with the cold interval in the IR images of Hole U1327C (130–160 mbsf), except for a ~10 m depth difference. The resistivity log in Hole U1327D shows a high resistivity interval at 155–160 mbsf, which correlates with a cold interval observed in the IR images from the same hole. The resistivity log in Hole U1327E does not show a high resistivity interval at 155–160 mbsf.
Previous | Close | Next | Top of page