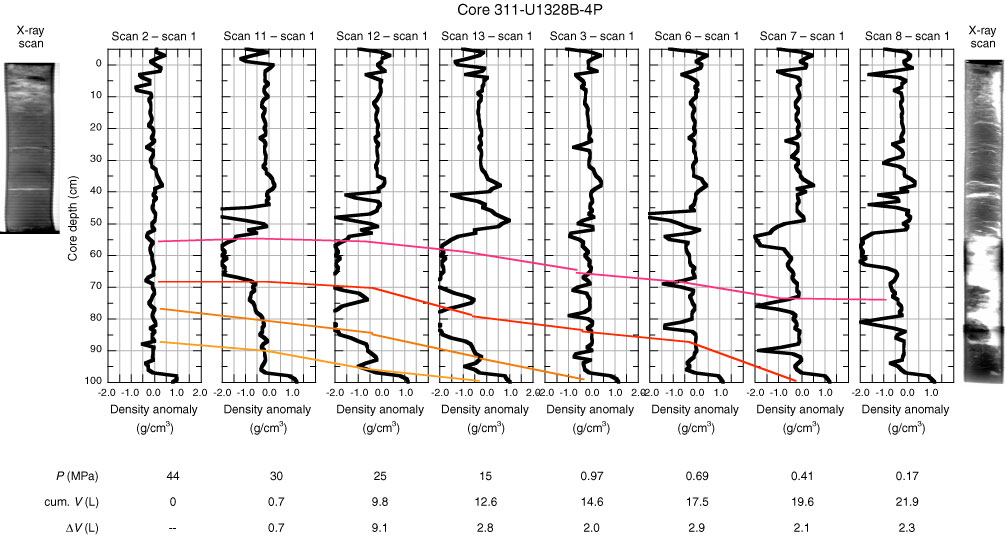
Figure F54. Repeated gamma ray density scans plotted as differential density profiles (i.e., the initial density profile has been subtracted from each of the subsequent profiles) taken during the degassing of Core 311-U1328B-4P showing movement of sediment and gas out of the bottom of the inner core barrel. X-ray images taken before and after degassing are shown on either side of the differential density profiles. P = pressure, cum. V = cumulative volume,
![]() V = change in volume.
V = change in volume.

Previous | Close | Next | Top of page