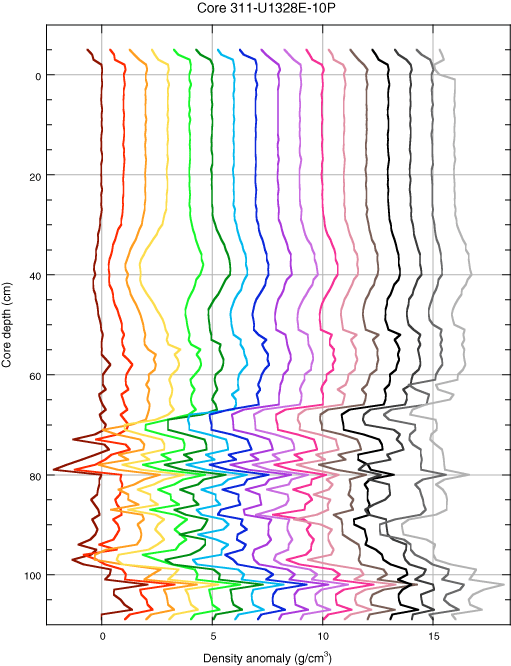
Figure F55. Repeated gamma ray density scans taken during the degassing of Core 311-U1328E-10P showing movement of sediment and gas out of the bottom of the inner core barrel. The data are plotted as differential density profiles (i.e., as profiles from which the initial gamma ray density scan has been subtracted). Each successive profile is offset by 1 g/cm3. Top of sediment is at ~63 cm core depth and rises during the experiment. Excursions in the graphs between 30 and 50 cm core depth are an artifact created by the interaction between the PCS and the vertical multisensor core logger.

Previous | Close | Next | Top of page