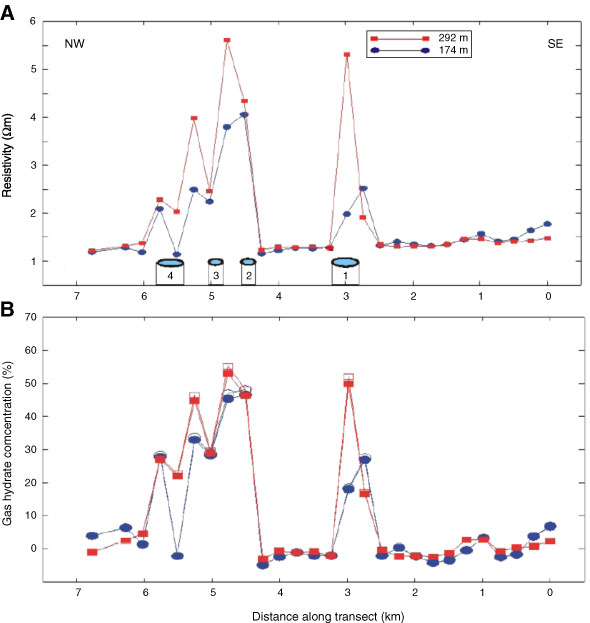
Figure F9. Profile of (A) electrical resistivity and (B) inferred gas hydrate concentration along a profile across the cold vent field (from Schwalenberg et al., 2005). Blank zones are denoted by the numbered ovals.
Previous | Close | Next | Top of page