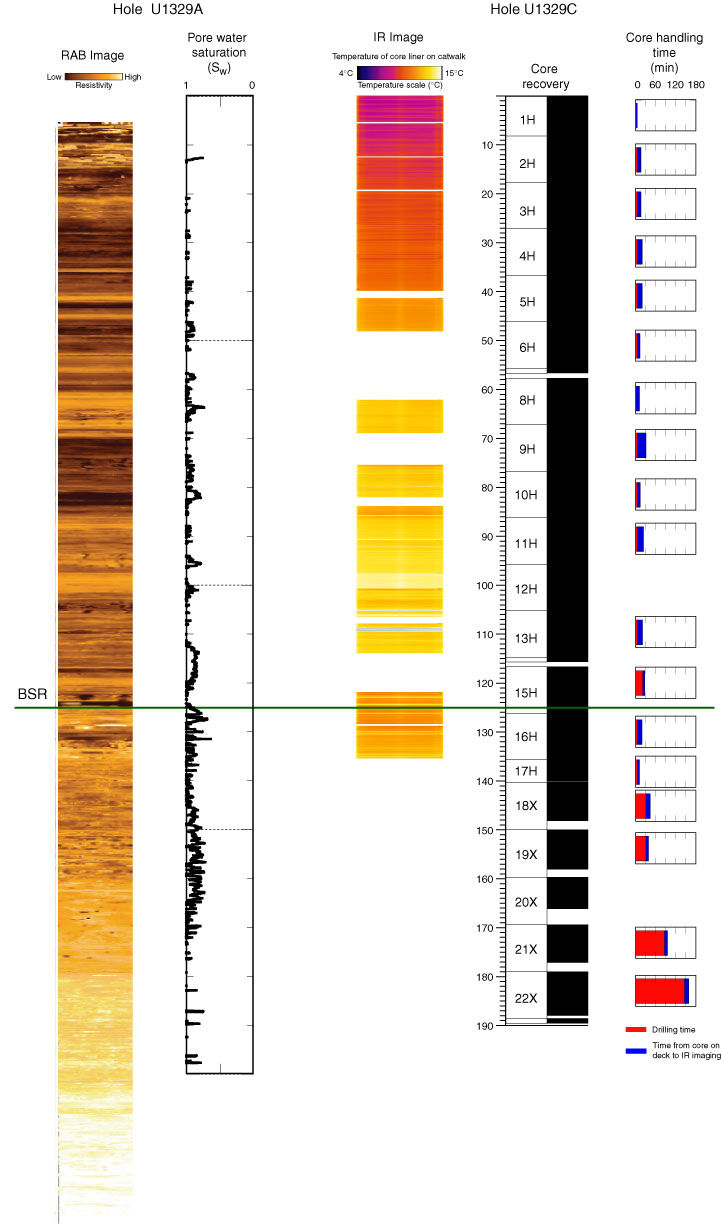
Figure F31. Combined infrared (IR) images of core liner temperature from Hole U1329C, compared to LWD resistivity and calculated pore water saturation from Hole U1329A. Core recovery and core handling time are also shown. RAB = resistivity-at-the-bit, BSR = bottom-simulating reflector. (This figure is also available in an oversized format).

Previous | Close | Next | Top of page