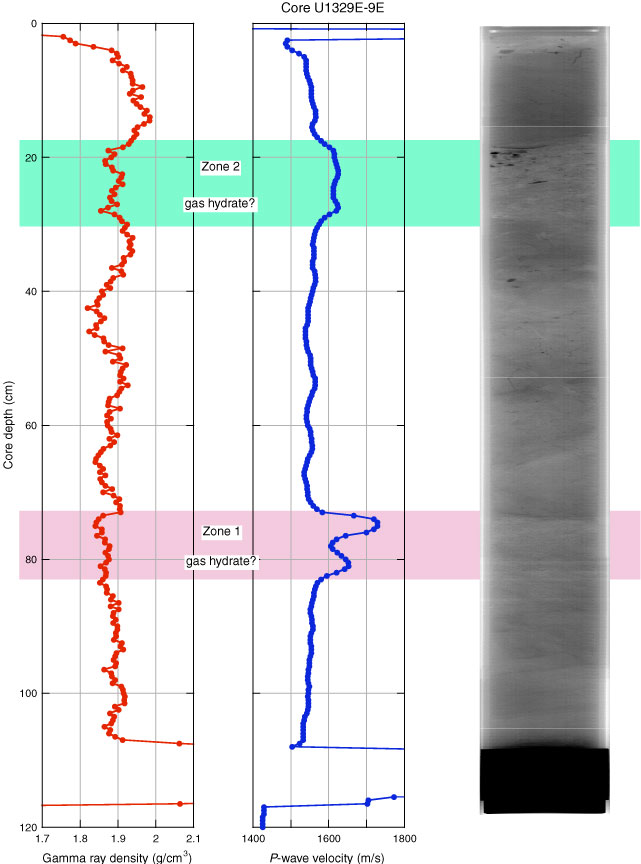
Figure F48. Data collected at in situ pressure (12 MPa) and 7°C for Core 311-U1329E-9E, including gamma ray density, P-wave velocity, and X-ray image. Two low-density, high-velocity zones are highlighted in color. X-ray images have been stretched 250% in the cross-core direction to show detail.
Previous | Close | Next | Top of page