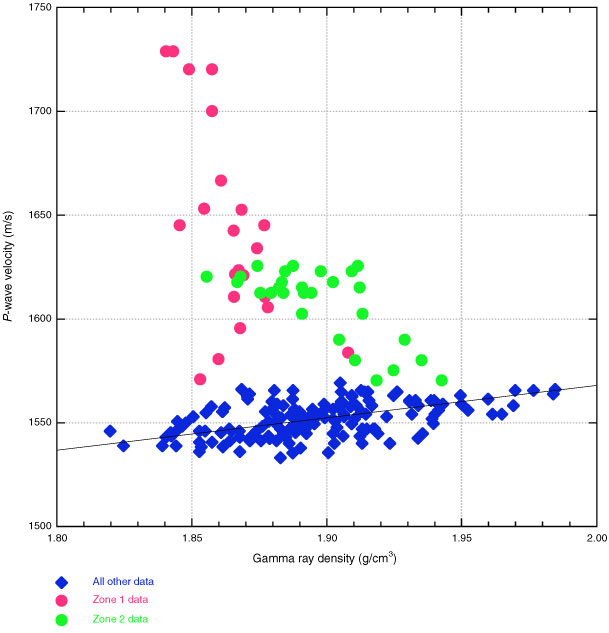
Figure F49. Gamma ray density vs. P-wave velocity for Core 311-U1329E-9E, showing the anomalous trend in Zones 1 and 2 (identified in Fig. F48), which evolved gas when degassed (Fig. F51) and contained gas hydrate.
Previous | Close | Next | Top of page