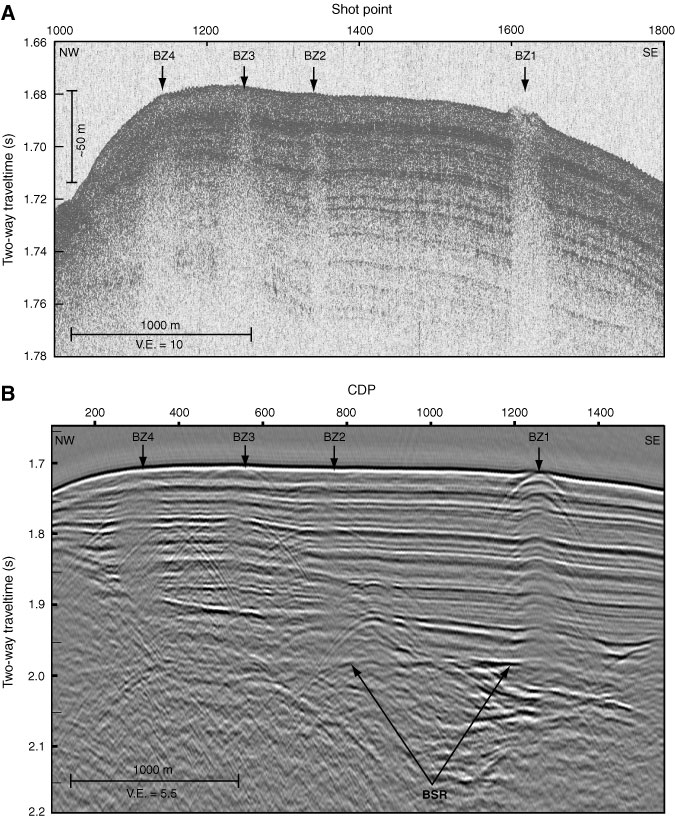
Figure F10. Seismic sections across cold vents near ODP Site 889. V.E. = vertical exaggeration, BZ = blank zone. A. 3.5 kHz subbottom profiler data. B. Multichannel seismic (MCS) Inline 27 (stack) from 1999 pseudo-3-D seismic survey. A bottom-simulating reflector (BSR) is faintly visible beneath the vent field in the MCS data. Blanking is increased in the higher frequency subbottom profiler data (after Riedel et al., 2002). CDP = common depth point.
Previous | Close | Next | Top of page