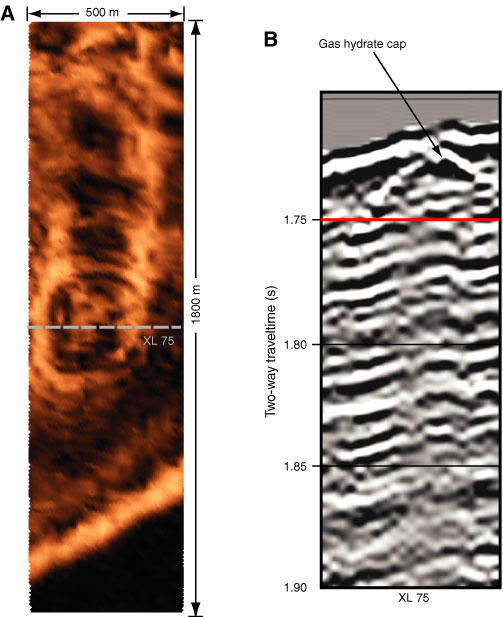
Figure F11. A. Time slice of instantaneous amplitude from single-channel seismic (SCS) 3-D grid at 1.752 ms two-way traveltime taken from 2000 grid over Bullseye vent. Diffraction rims are seen are bright colors (orange) surrounding the individual cold vents as a result of interference of diffractions with regular reflectors. B. Cross Line (XL) 75 from the 2000 SCS data showing hydrate cap reflector at Bullseye vent. Note reduced seismic amplitudes below center of the vent. Hydrate was recovered in piston Core C-6 at a depth of ~6.5 m below seafloor (after Riedel et al., 2002).
Previous | Close | Next | Top of page