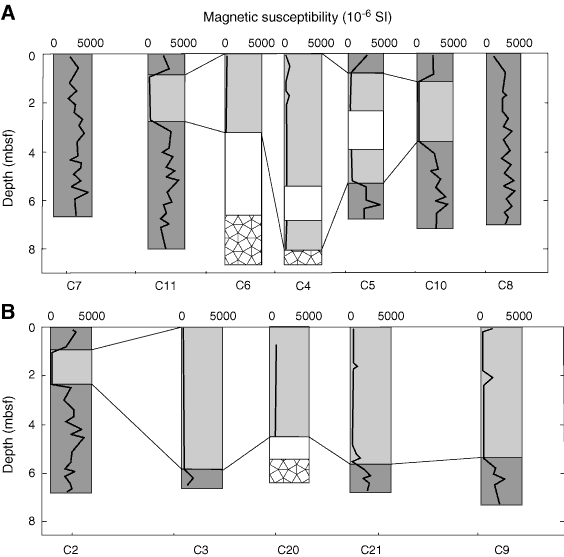
Figure F12. (A) Magnetic susceptibility along Transect 1 and (B) Transect 2 (10 cm sampling interval). High magnetic susceptibility values mostly range from ~2500 to 3000 × 10–6 SI (darker shaded area), whereas low magnetic susceptibility values mostly range from 50 × 10–6 to 500 × 10–6 SI (lighter shaded area). Patterned areas represent sections that contained massive gas hydrate. Depth ranges with no available data are shown in white (after Novosel et al., 2005).

Previous | Close | Next | Top of page