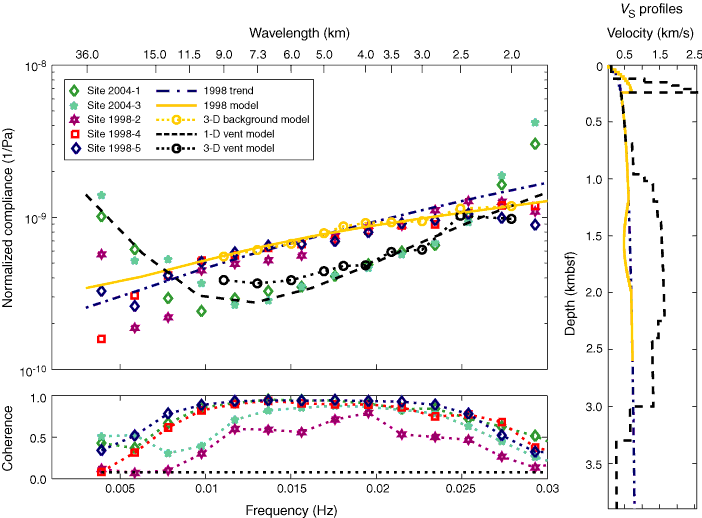
Figure F13. Normalized compliance, coherence, and velocity profiles. The regional trend velocity-depth model and calculated compliance with frequency are shown by the blue dotted lines and 1998 best-fit model of regional gas hydrate above the BSR by the solid red lines. The cold vent model is shown by the dashed line. The 3-D finite difference vent model compliance results are indicated by red stars (after Willoughby et al., 2005).
Previous | Close | Next | Top of page