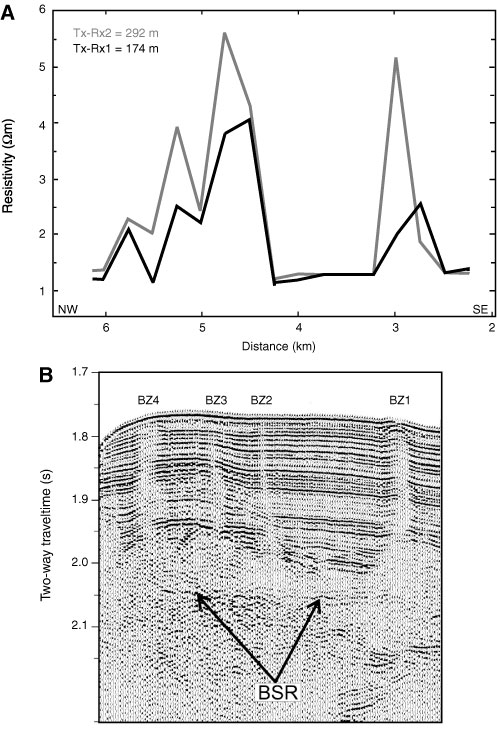
m) showing local high-resistivity anomalies >5 m spatially correlated with blank Zones 1–4. B. Seismic line from 1999 single-channel seismic 3-D survey (coincident to Inline 27 shown in Fig. F10) on the same horizontal scale (after Schwalenberg et al., 2005). BSR = bottom-simulating reflector, BZ = blank zone.