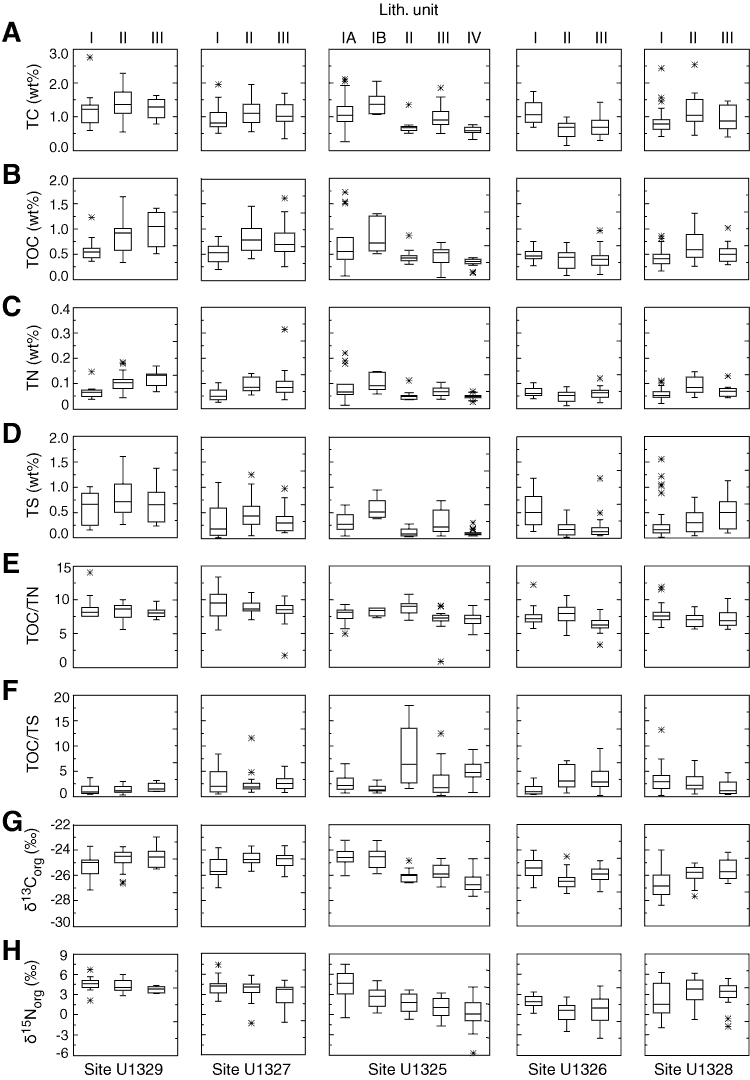
Figure F2. Element concentration, ratio, and isotope values by lithostratigraphic unit. Horizontal line = median, bottom box = first quartile (Q1), top box = third quartile (Q3), whiskers = lowest and highest observations inside the regions Q1 – 1.5(Q3 – Q1) and Q3 – 1.5(Q3 – Q1), respectively. * = outliers. A. Total carbon (TC). B. Total organic carbon (TOC). C. Total nitrogen (TN). D. Total sulfur (TS). E. TOC/TN. F. TOC/TS. G. Carbon isotope. H. Nitrogen isotope.

Previous | Close | Next | Top of page