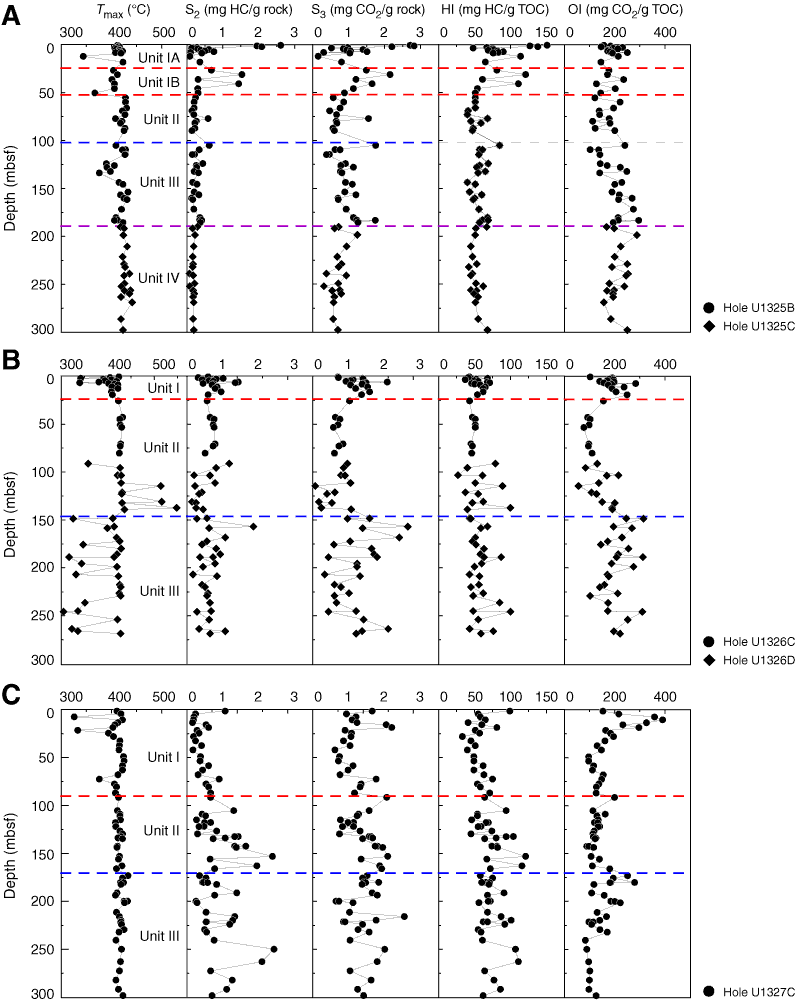
Figure F3. Rock-Eval pyrolysis profiles. S2 = second peak, S3 = third peak, Tmax = temperature at S2, HI = hydrogen index, HC = hydrocarbon, TOC = total organic carbon, OI = oxygen index. A. Site U1325. B. Site U1326. C. Site U1327. (Continued on next page.)

Previous | Close | Next | Top of page