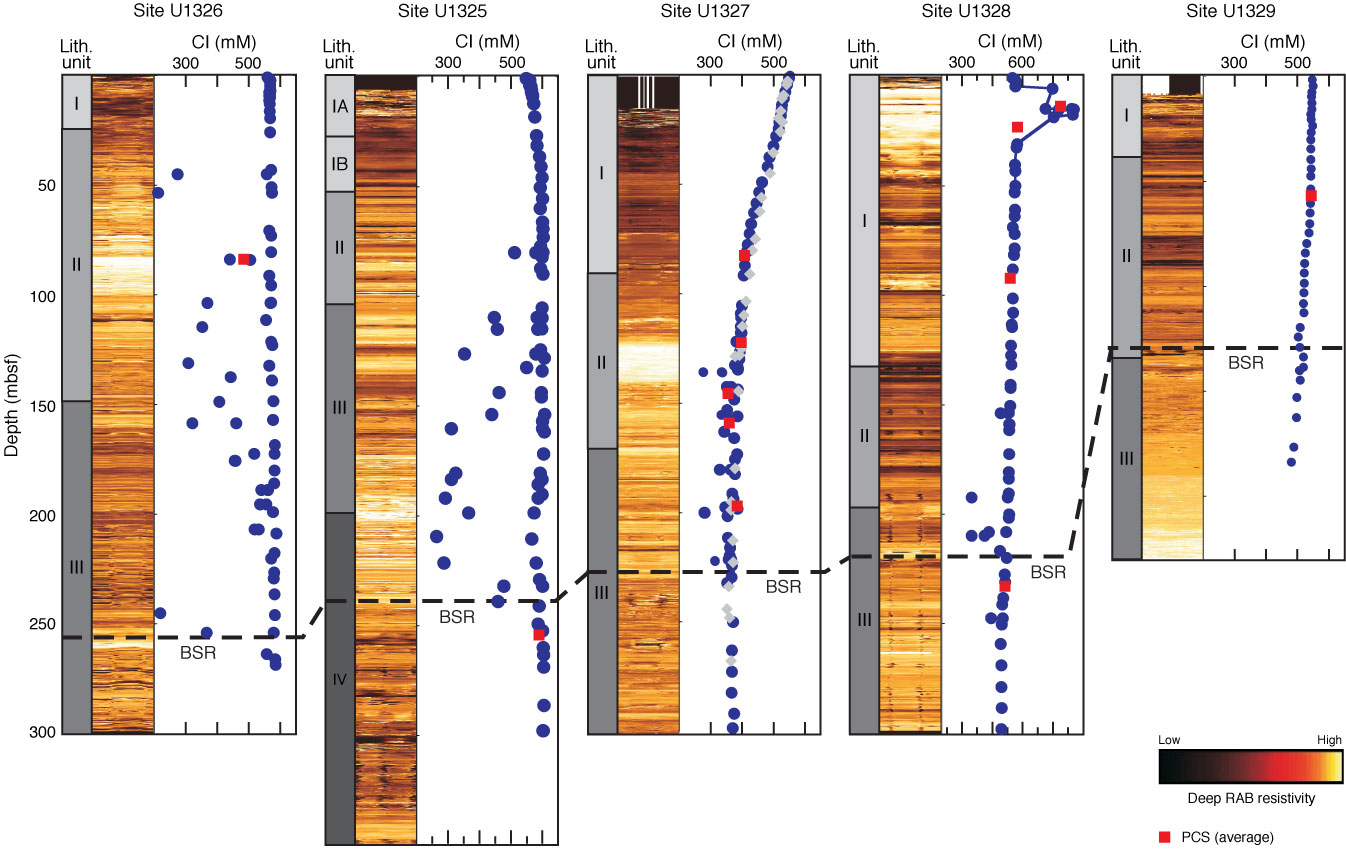
Figure F6. Comparison of logging-while-drilling (LWD) data with core-derived pore water chlorinity values. Shown for all sites are the main lithologic units, color-coded resistivity-at-the-bit (RAB) resistivity data, and pore water chlorinity from the recovered cores (blue) and pressure cores (red) as well as results from ODP Leg 146, Sites 889 and 890 (gray). BSR = bottom-simulating reflector, PCS = Pressure Core Sampler.
Previous | Close | Next | Top of page