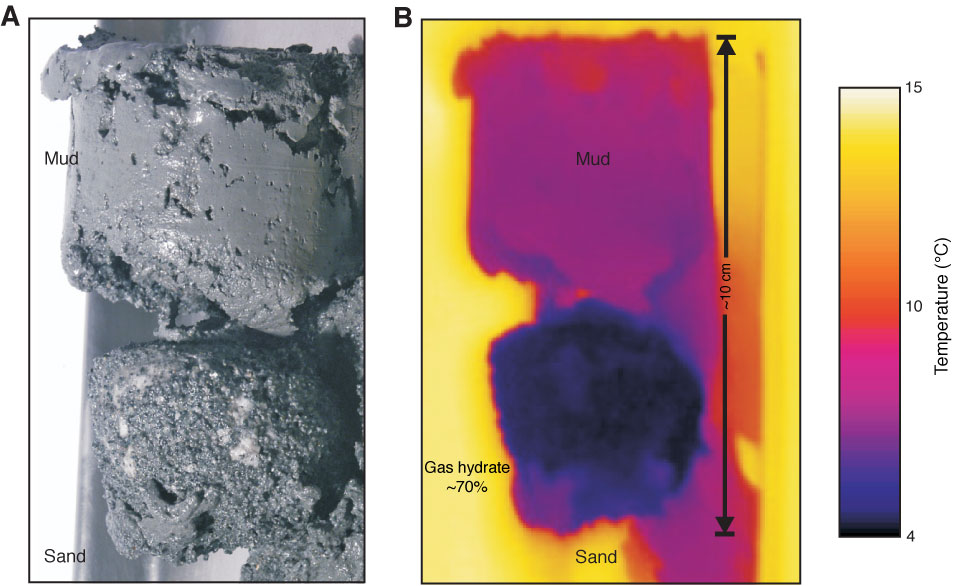
Figure F7. Evidence for grain-size control on gas hydrate occurrence. A. Photograph of a recovered core at Site U1326 (311-U1326C-6X-4, 83–96 cm [44.85 mbsf]). B. Infrared (IR) image made in the geochemistry laboratory (modified after Torres et al., 2008). The IR temperature color scale is given on the right-hand side of the image. The sandy portion of the entire sample shown contains ~70% gas hydrate in the pore space, as defined from pore water freshening compared to the assumed background, whereas the mud portion contains no gas hydrate (within the uncertainty of knowing the background salinity).
Previous | Close | Next | Top of page