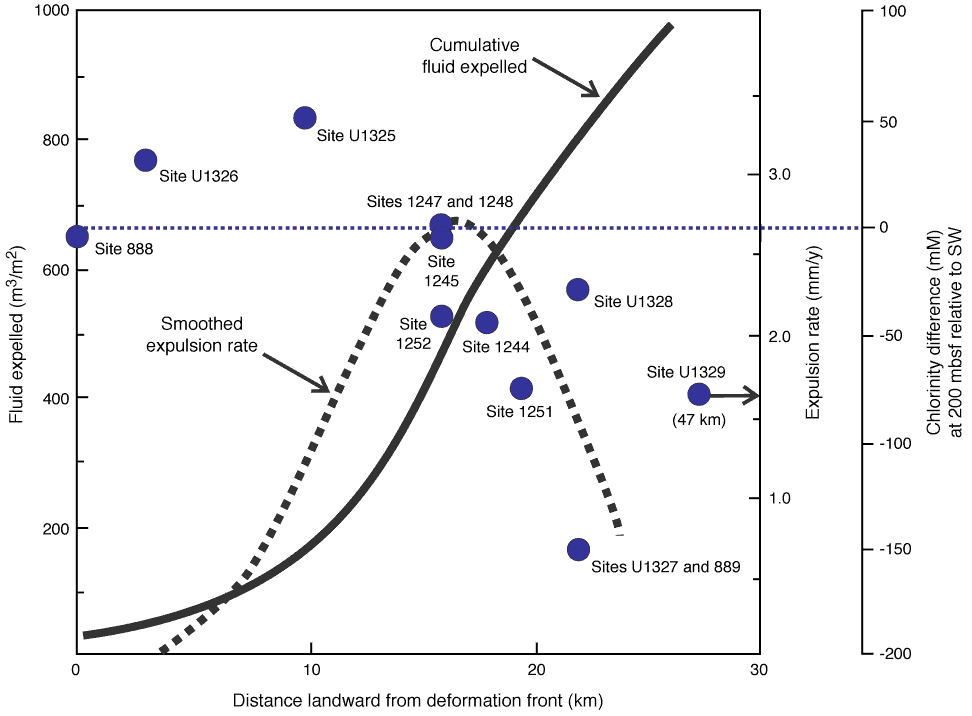
Figure F8. Comparison of fluid expulsion rates and total fluid expelled (as modeled by Hyndman and Davis, 1992) with observed total pore water freshening at a common depth of 200 mbsf observed at drill sites from ODP Legs 146 and 204 and IODP Expedition 311. SW = seawater.

Previous | Close | Next | Top of page