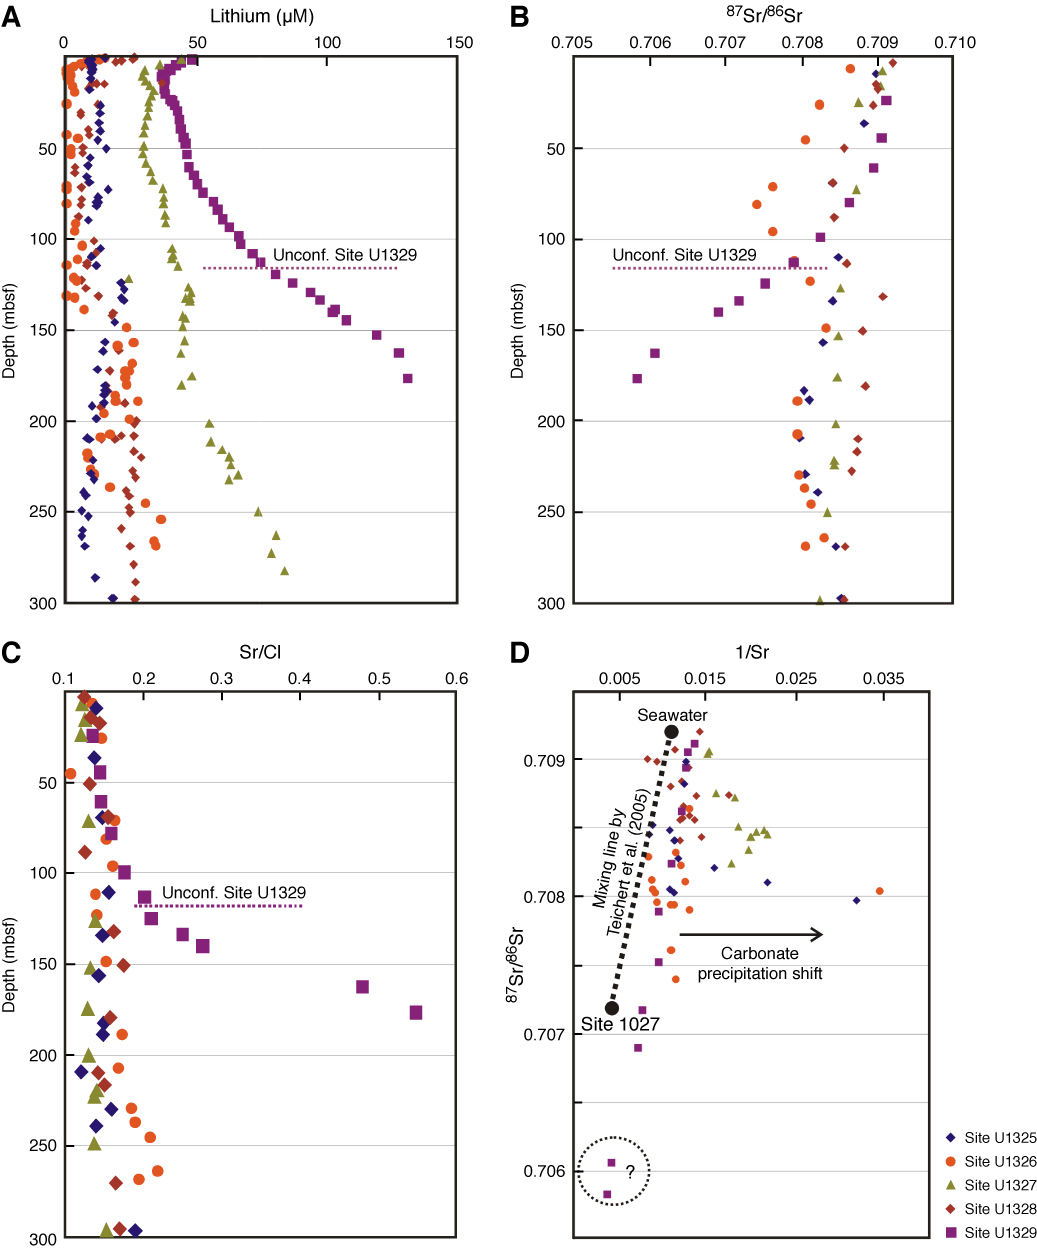
Figure F9. Depth profiles of lithium and strontium pore water data from the Expedition 311 transect. A. Lithium. B. Isotopic ratio of 87Sr/86Sr. C. Strontium normalized to chlorinity. D. Mixing diagram of strontium data from Expedition 311 compared to results from ODP Leg 204 by Teichert et al. (2005). Unconf. = unconformity.
Previous | Close | Next | Top of page