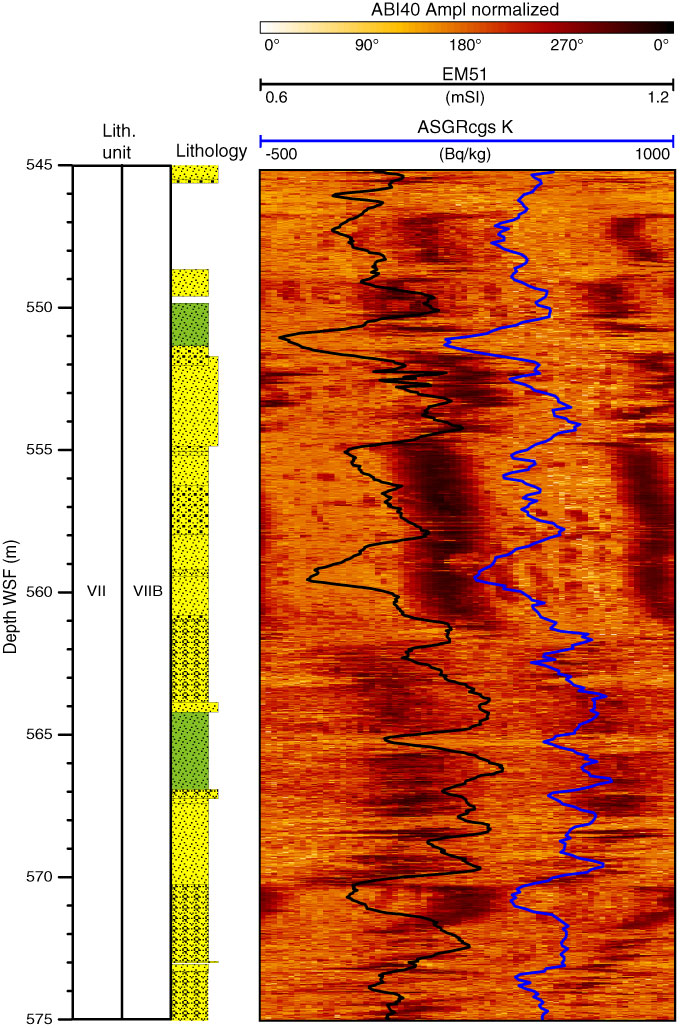
Figure F59. Composite of downhole log data for Hole M0027A illustrating parallel trends of normalized amplitude image (ABI40 Ampl), potassium content (ASGRcgs K), and magnetic susceptibility (EM51). See Figure F4 in the "Methods" chapter for lithology legend.
Previous | Close | Next | Top of page