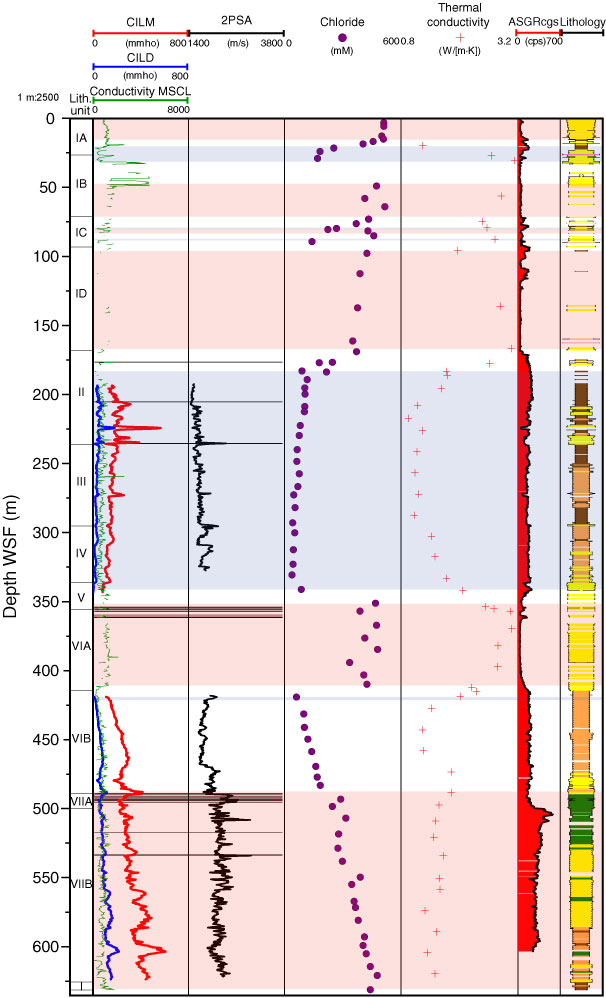
Figure F60. Chlorinity in pore water and thermal conductivity, sonic velocity, total gamma ray, and electrical conductivity measured on cores shown with downhole logging data for Hole M0027A. Conductivity (CILM and CILD), P-wave sonic (2PSA), and spectral gamma ray through pipe (ASGRcgs). Cemented levels observed by sedimentologists are plotted as pink lines/bars across the sonic and conductivity logs, which are anticipated to show an increase and decrease, respectively, at most of these horizons. Yellow and blue bars represent intervals of high salinity and freshwater, respectively (see "Geochemistry"). White shading shows transitional areas between "freshwater" and "saltwater" zones. See Figure F1 for lithology legend.
Previous | Close | Next | Top of page