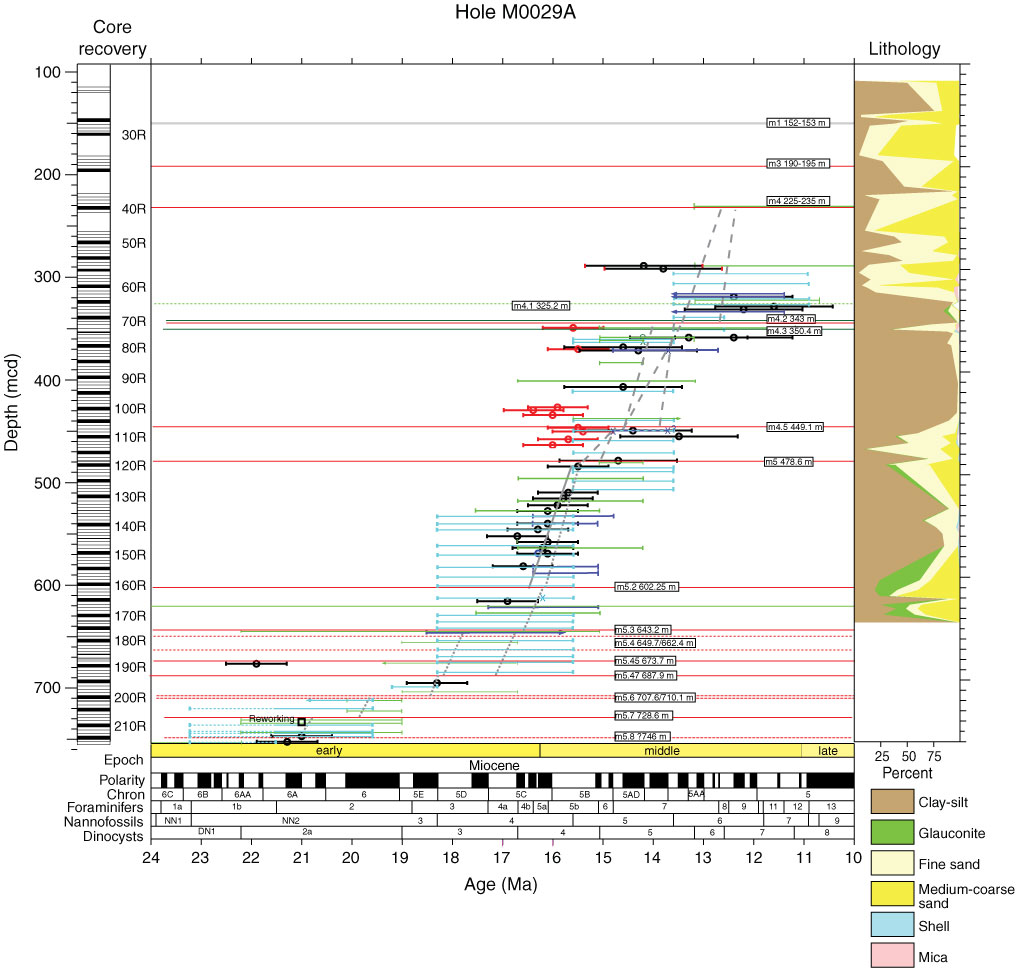
Figure F18. Age-depth plot showing core recovery (every fifth core shaded), the timescale of Berggren et al. (1995), calcareous nannoplankton zones (light blue bars), planktonic foraminifer zones (dark blue bars), and dinocyst zones (green bars). Select highest/last occurrences (x) are shown for nannoplanktons, foraminifers, and dinocysts. Sr isotopic ages are shown as circles with errors of ±0.6 m.y. (older than 15.2 Ma) and ±1.17 m.y. (younger than 15.2 Ma). Red Sr isotope ages are interpreted as reworked. Horizontal lines for sequence boundaries (red) and tentative sequence boundaries (dashed red) lines are labeled with their corresponding depths. Horizontal green lines = flooding surfaces. Planktonic foraminifer zones from Berggren et al. (1995), nannofossil zone from Martini (1971), and dinocyst zones from de Verteuil and Norris (1996). Geomagnetic polarity timescale from Cande and Kent (1995).
Previous | Close | Next | Top of page