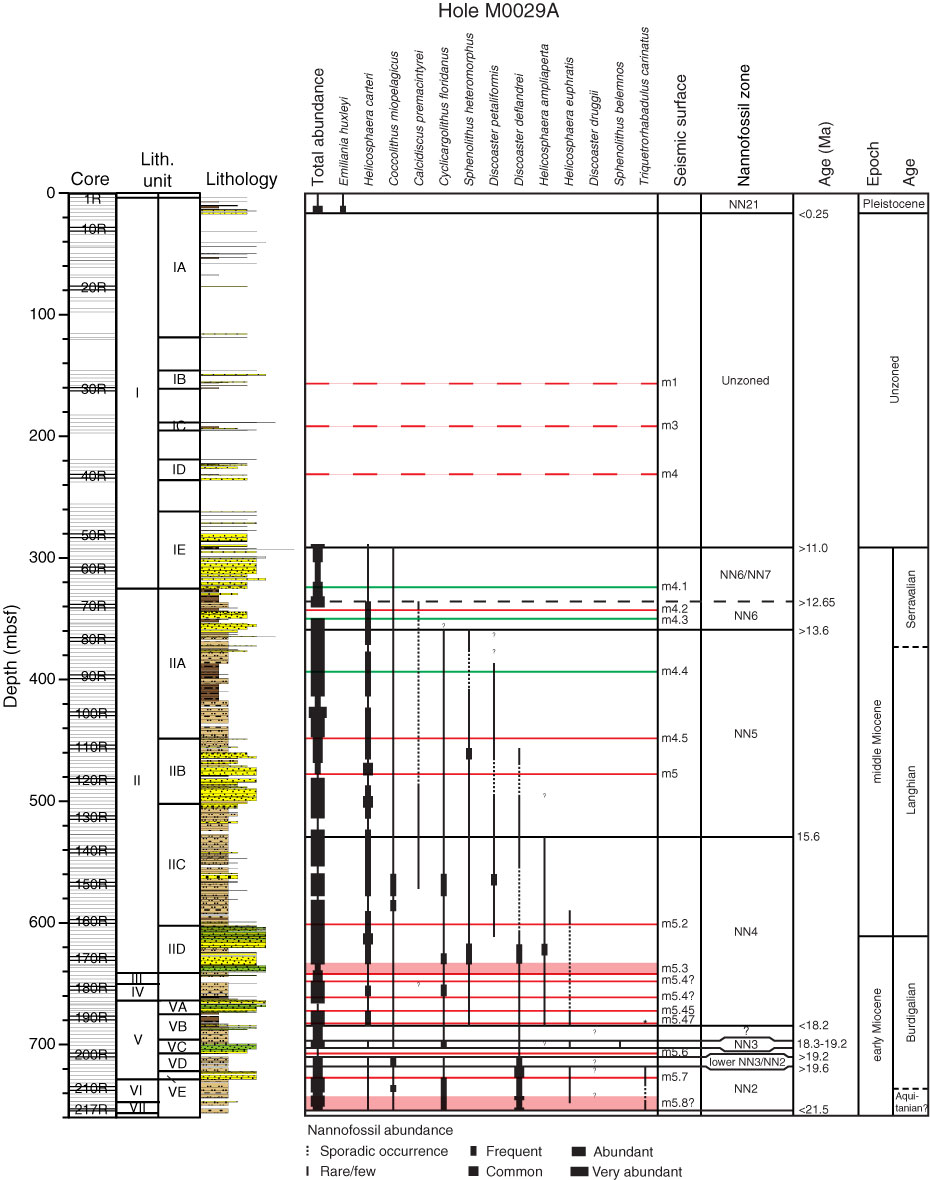
Figure F19. Distribution of biostratigraphically important calcareous nannofossil taxa in Hole M0029A. Thickness of distribution line indicates relative abundance of species. Zonal assignments (Martini, 1971) are given, with approximate age indicated. Red lines = sequence boundaries, green lines = major flooding surfaces. See Figure F4 in the "Methods" chapter for lithology legend.
Previous | Close | Next | Top of page