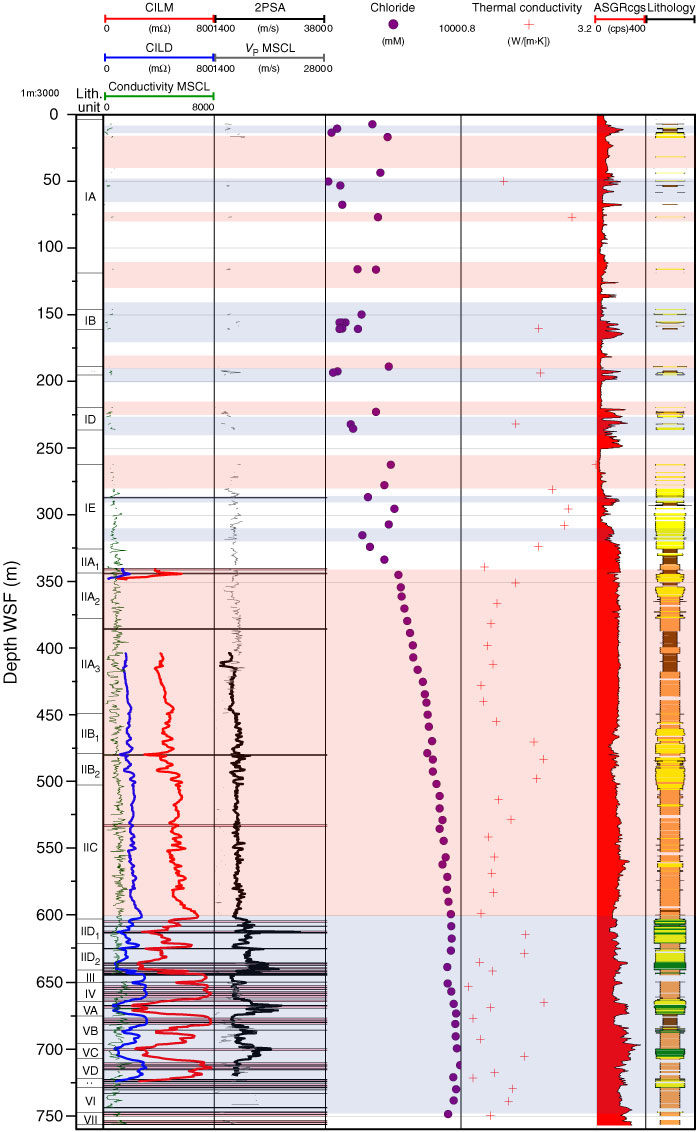
Figure F36. Petrophysical and downhole log data across the m5.3 boundary in Hole M0029A, together with MSCL gamma ray density and P-wave velocity. Normalized amplitude and traveltime acoustic images (ABI40 ampl and ABI40 TT), hole diameter (AcCal), total gamma ray through pipe (ASGRcgs), downhole magnetic susceptibility (EM51), whole core natural gamma radiation (NGR), and magnetic susceptibility (MagSus MSCL). A composite of line scan images is shown alongside core depth and whole core measurement have been shifted down by 0.40 m to match the wireline depth.

Previous | Close | Next | Top of page