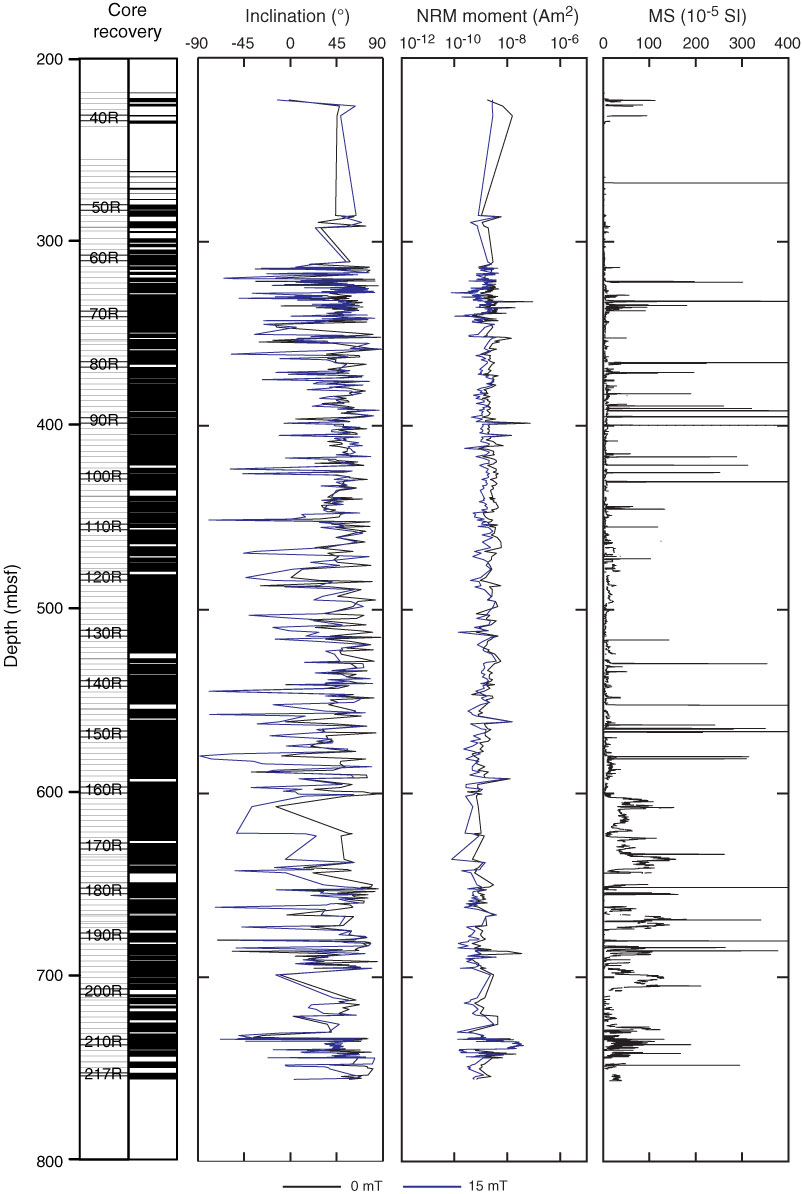
Figure F37. Inclination and magnetic moment data for Hole M0029A for initial NRM (black) and after 15 and 30 mT alternating field demagnetization (blue and red, respectively). MSCL magnetic susceptibility (MS) is also shown for reference.
Previous | Close | Next | Top of page