Previous | Close | Next
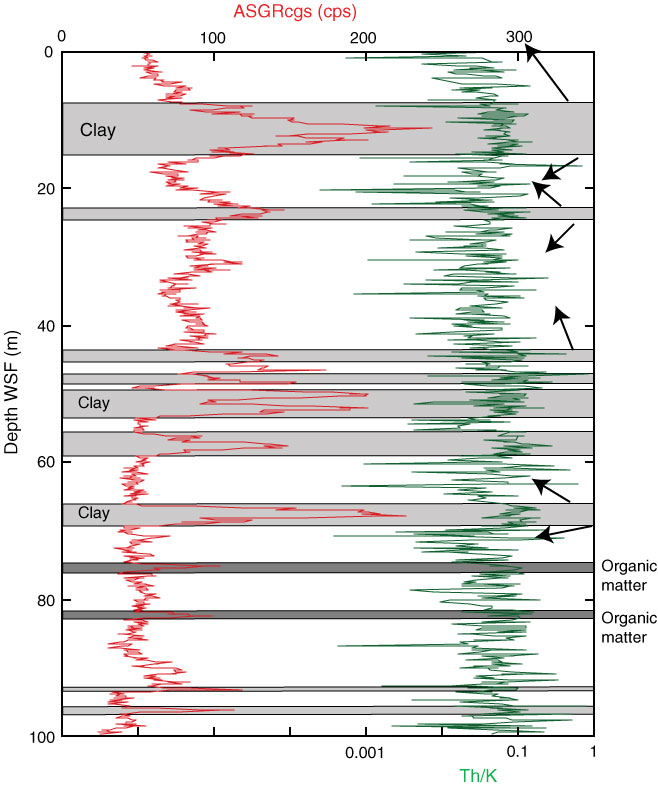
Figure F42. Total gamma ray (AGSRcgs; red curve) and Th/K ratio (green curve; logarithmic scale) with tentative lithological interpretation in the upper part of Hole M0029A (poor recovery).
Previous | Close | Next | Top of page