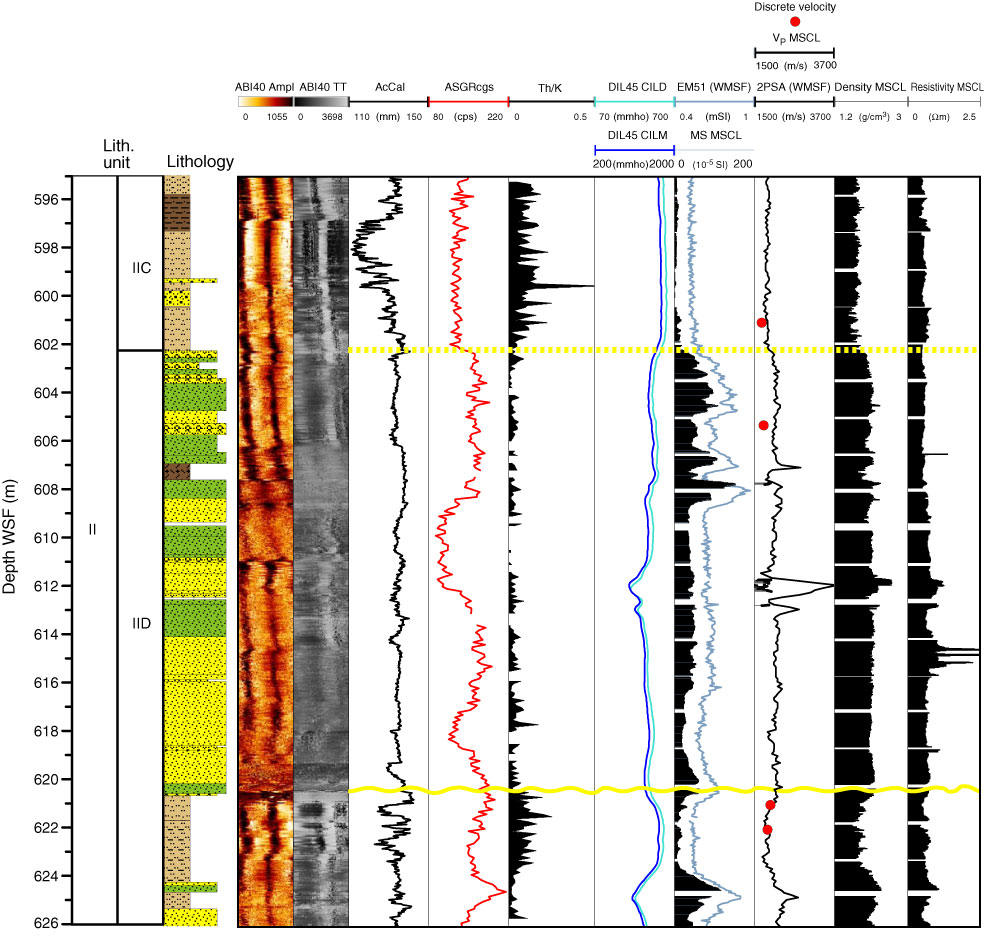
Figure F43. Composite of petrophysical and downhole logging data between 596 and 626 m WSF, Hole M0029A, to show two key surfaces (yellow lines) identified from the petrophysical data, both corresponding to a subunit boundary and the upper to the m5.2 surface. Normalized amplitude and traveltime acoustic images (ABI40 Ampl and ABI40 TT), hole diameter (AcCal), total gamma ray through pipe (AGSRcgs), Th/K ratio (from ASGR), conductivity (DIL45), magnetic susceptibility (EM51 and multisensor core logger [MSCL]), and P-wave (2PSA) in m WSF. Density and P-wave (MSCL), P-wave discrete, and resistivity from MSCL measurements on cores are in mbsf. See Figure F4 in the "Methods" chapter for lithology legend.
Previous | Close | Next | Top of page